Build specifications for covariate effect simulation/visualization
build_spec_coveff.RdBuild specifications for covariate effect simulation/visualization
Usage
build_spec_coveff(
  ermod,
  data = NULL,
  qi_width_cov = 0.9,
  n_sigfig = 3,
  use_seps = TRUE,
  drop_trailing_dec_mark = TRUE
)
Arguments
- ermod
an object of class
ermod(supportsermod_binandermod_lin)- data
an optional data frame to derive the covariate values for forest plots. If NULL (default), the data used to fit the model is used.
- qi_width_cov
the width of the quantile interval for continuous covariates in the forest plot. Default is 0.9 (i.e. visualize effect of covariate effect at their 5th and 95th percentile values).
- n_sigfig
Number of significant figures to form value_label of continuous variables. See
gt::vec_fmt_number()for details.- use_seps
Whether to use separators for thousands in printing numbers. See
gt::vec_fmt_number()for details.- drop_trailing_dec_mark
Whether to drop the trailing decimal mark (".") in value_label of continuous variables. See
gt::vec_fmt_number()for details.
Value
spec_coveff (return object) is a data frame for the specification
of the covariate effects to be visualized. This is internally generated by
build_spec_coveff() if you run sim_coveff() or plot_coveff()
directly. Alternatively, you can develop your own or modify the one
generated by build_spec_coveff() and supply it to sim_coveff() or
plot_coveff(). The data frame should have the following columns (but
it's probably easier to try build_spec_coveff() and see the structure):
var_order: The order of the covariate in the forest plot. The exposure variable is always the first one and the covariates are ordered by the order they are supplied in thevar_covargument of thedev_ermod_*function. If you used a model fromdev_ermod_bin_cov_sel(), then the order is determined by the variable selection process.var_name: The name of the variable.var_label: The label of the variable to be used for plot. This is the same asvar_nameby default.value_order: The order of the value of the variable to be evaluated.value_annot: The annotation of the value of the variable to be evaluated. This appears on the right hand side of the forest plot.value_label: The label of the value of the variable to be evaluated.value_cont: The value for continuous variables.value_cat: The value for categorical variables.is_ref_value: Whether the value is the reference value.show_ref_value: Whether to show the reference value in the plot and table. This is TRUE by default for is_ref_value == TRUE, otherwise NA (and ignored).is_covariate: Whether the variable is a covariate (TRUE) or exposure variable (FALSE).
Examples
# \donttest{
data(d_sim_binom_cov_hgly2)
ermod_bin <- dev_ermod_bin(
data = d_sim_binom_cov_hgly2,
var_resp = "AEFLAG",
var_exposure = "AUCss_1000",
var_cov = c("BHBA1C_5", "RACE"),
)
spec_coveff <- build_spec_coveff(ermod_bin)
plot_coveff(ermod_bin, spec_coveff = spec_coveff)
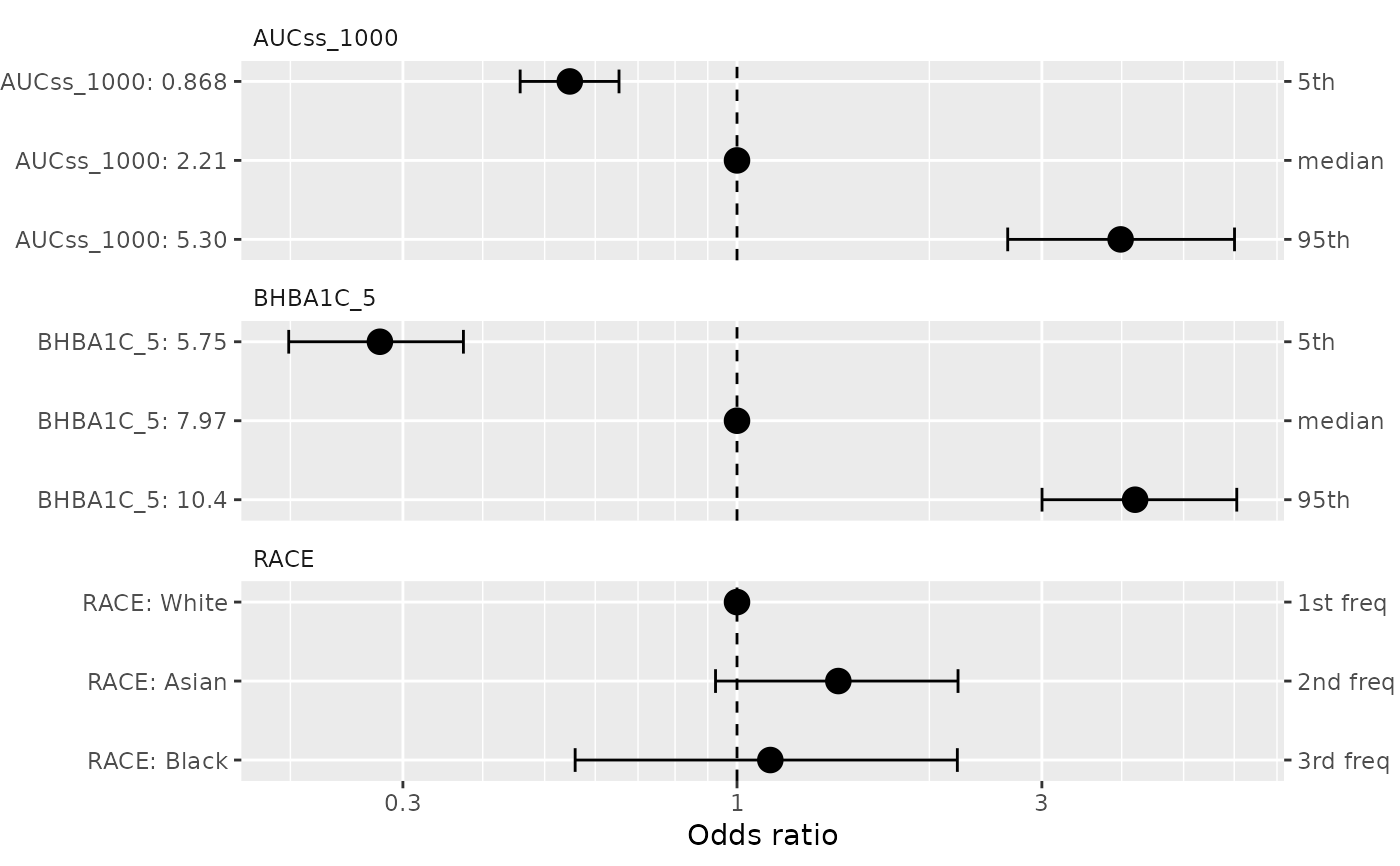 # }
# }