Plot variable selection performance
plot_cov_sel.RdPlot variable selection performance
Details
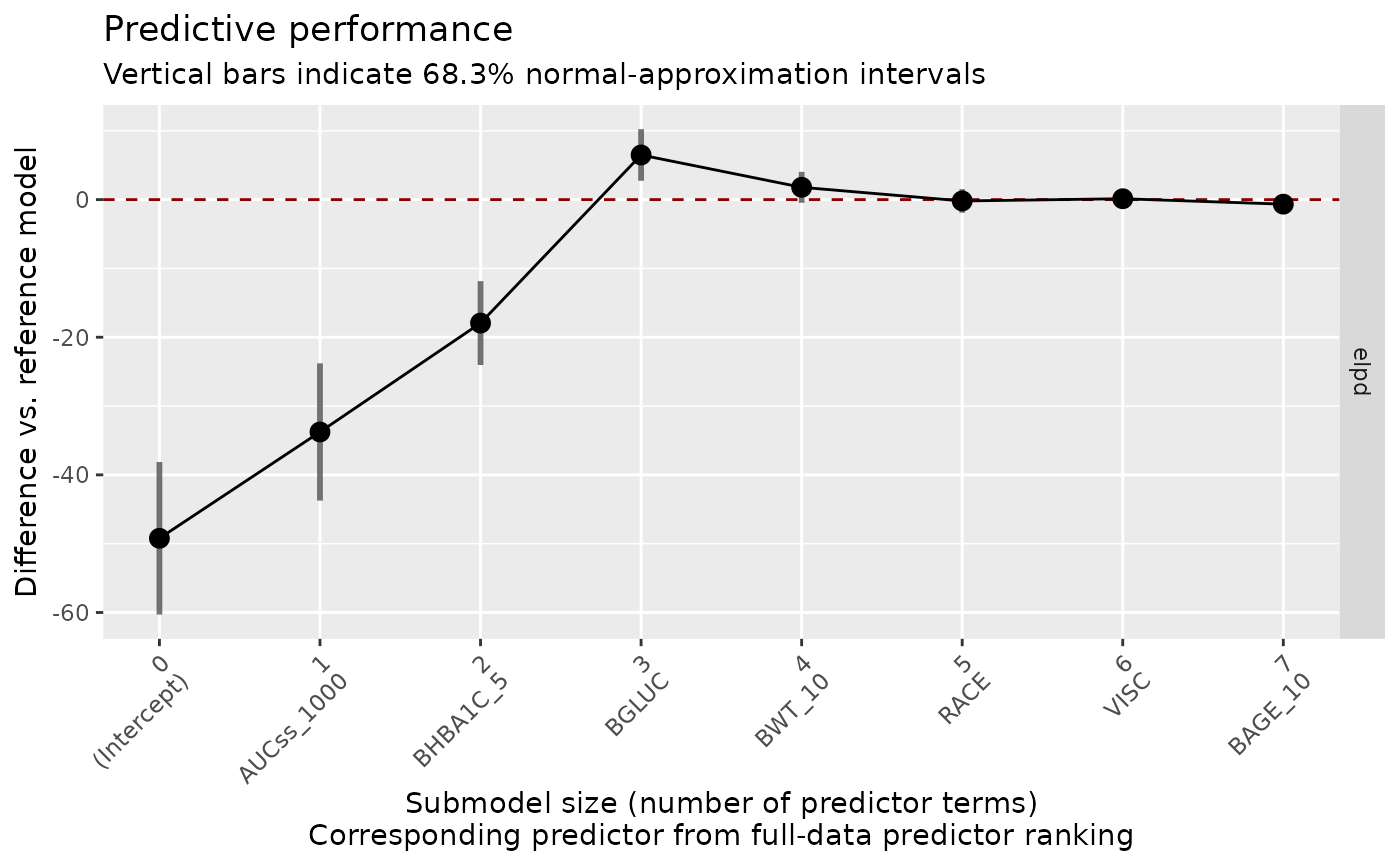
plot_submod_performance() plots the performance of submodels
evaluated during variable selection.
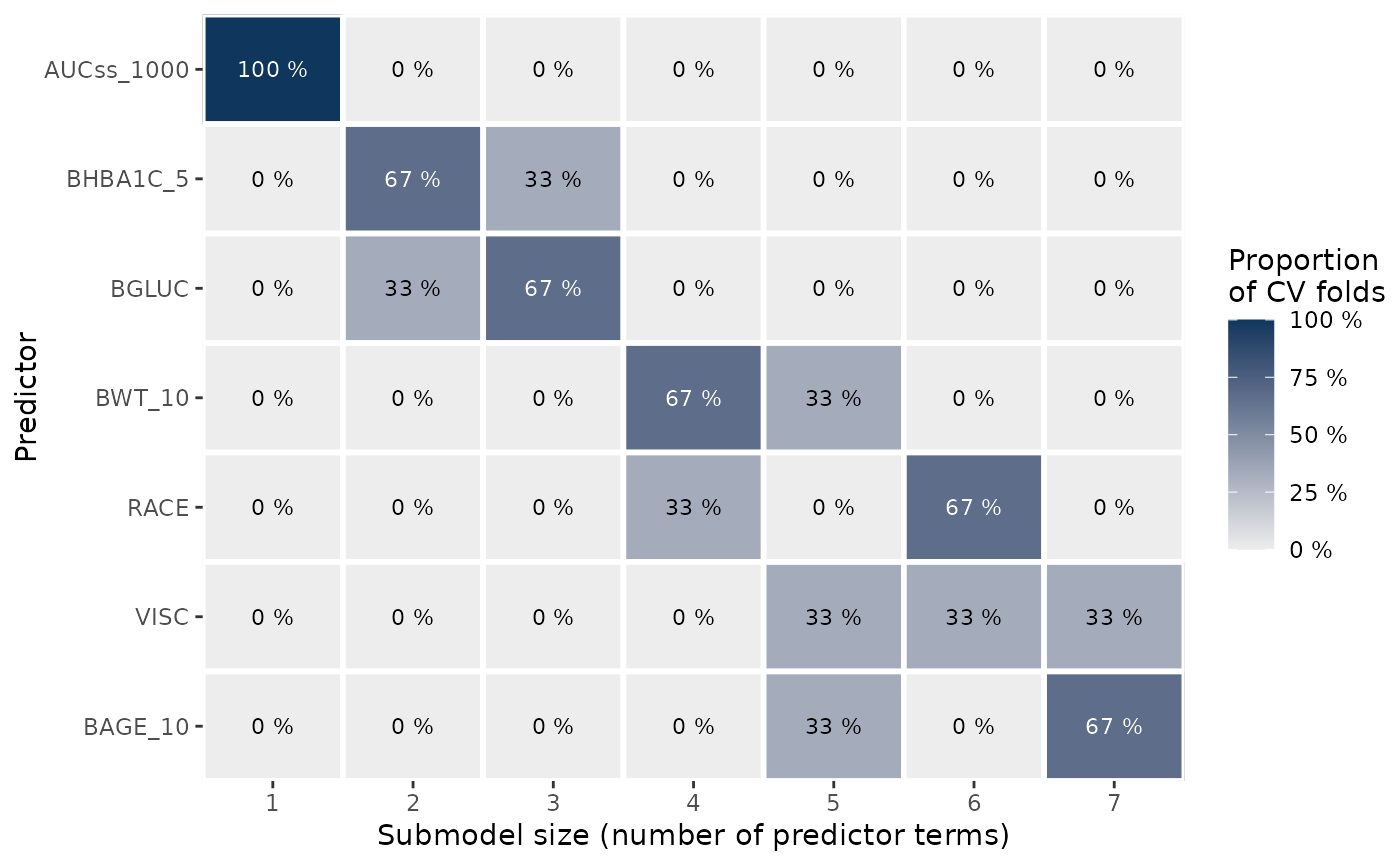
plot_var_ranking() plots the variable ranking
evaluated during variable selection.
Examples
# \donttest{
data(d_sim_binom_cov_hgly2)

er_binary_cov_model_kfold <- dev_ermod_bin_cov_sel(
  data = d_sim_binom_cov_hgly2,
  var_resp = "AEFLAG",
  var_exposure = "AUCss_1000",
  var_cov_candidate = c(
    "BAGE_10", "BWT_10", "BGLUC",
    "BHBA1C_5", "RACE", "VISC"
  ),
  cv_method = "kfold",
  k = 3, # Choose 3 to make the example go fast
  validate_search = TRUE,
)
#>
#> ── Step 1: Full reference model fit ──
#>
#> ── Step 2: Variable selection ──
#>
#> Fitting model 1 out of 3
#> Fitting model 2 out of 3
#> Fitting model 3 out of 3
#> ℹ The variables selected were: AUCss_1000, BHBA1C_5, BGLUC
#>
#> ── Step 3: Final model fit ──
#>
#> ── Cov mod dev complete ──
#>

plot_submod_performance(er_binary_cov_model_kfold)

plot_var_ranking(er_binary_cov_model_kfold)

# }
# }