CHART#
CHART (Cellular High-content imaging Archetype Response Toolkit) translates high-content imaging features into interpretable morphological phenotypes. CHART identifies marker-specific cellular archetypes, annotates representative images using multimodal large language models, and integrates co-regulated archetypes into morphological programs that describe coordinated cellular responses to perturbation.
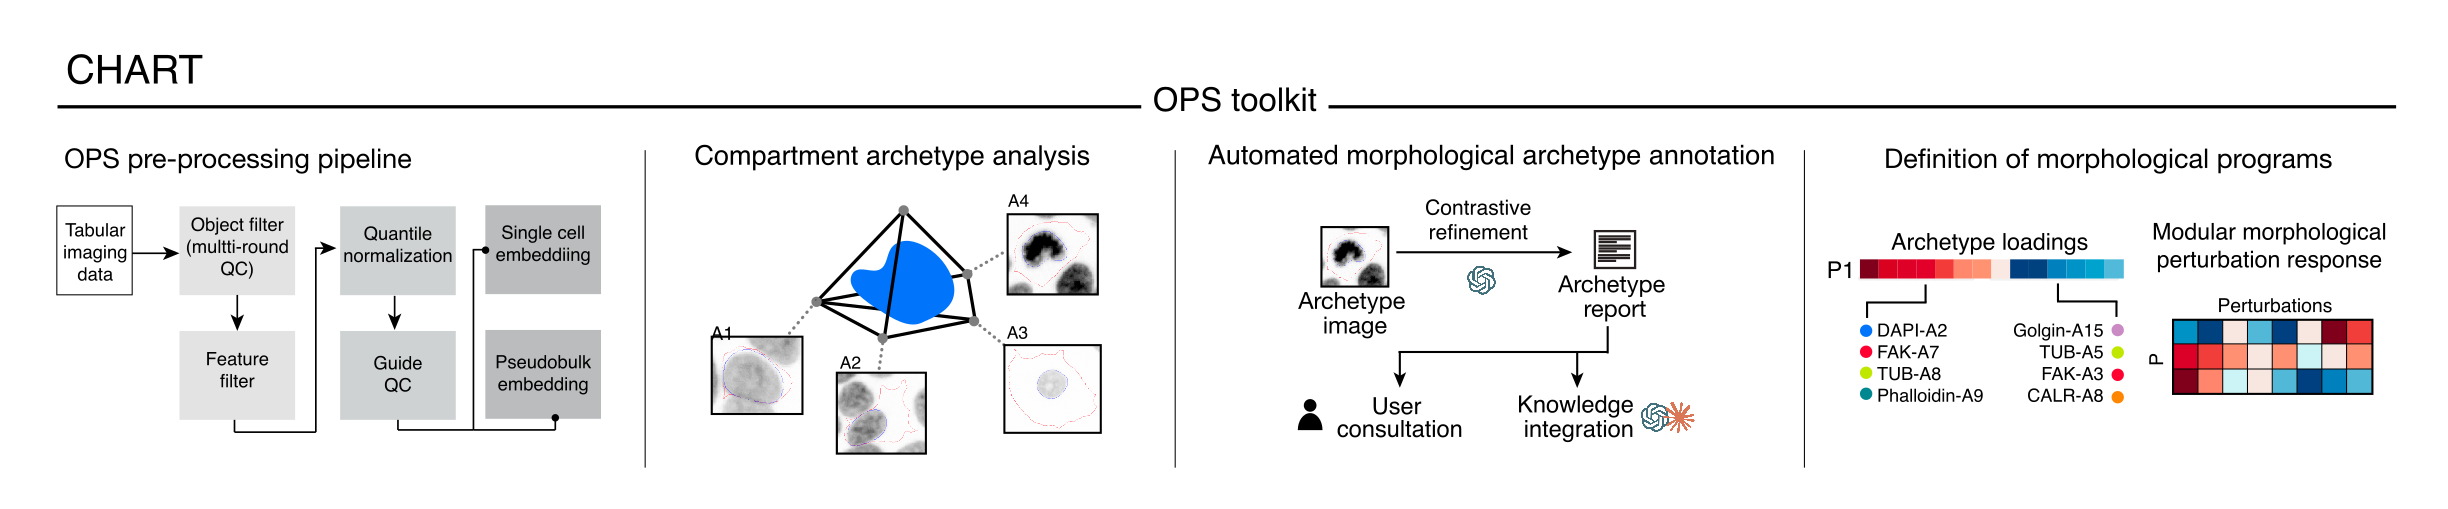
OPS preprocessing — quality control, filtering, normalization, outlier detection, guide filtering and single-cell/aggregated embeddings.
Compartment archetype analysis — identification of distinctive reference morphological states for each imaged marker.
Automated archetype annotation — contrastive image analysis and standardized reports generated with multimodal language models and user review.
Morphological program definition — integration of co-regulated archetypes into interpretable programs of coordinated cellular change.
Start with Installation and Your data; a quickstart is in the README.