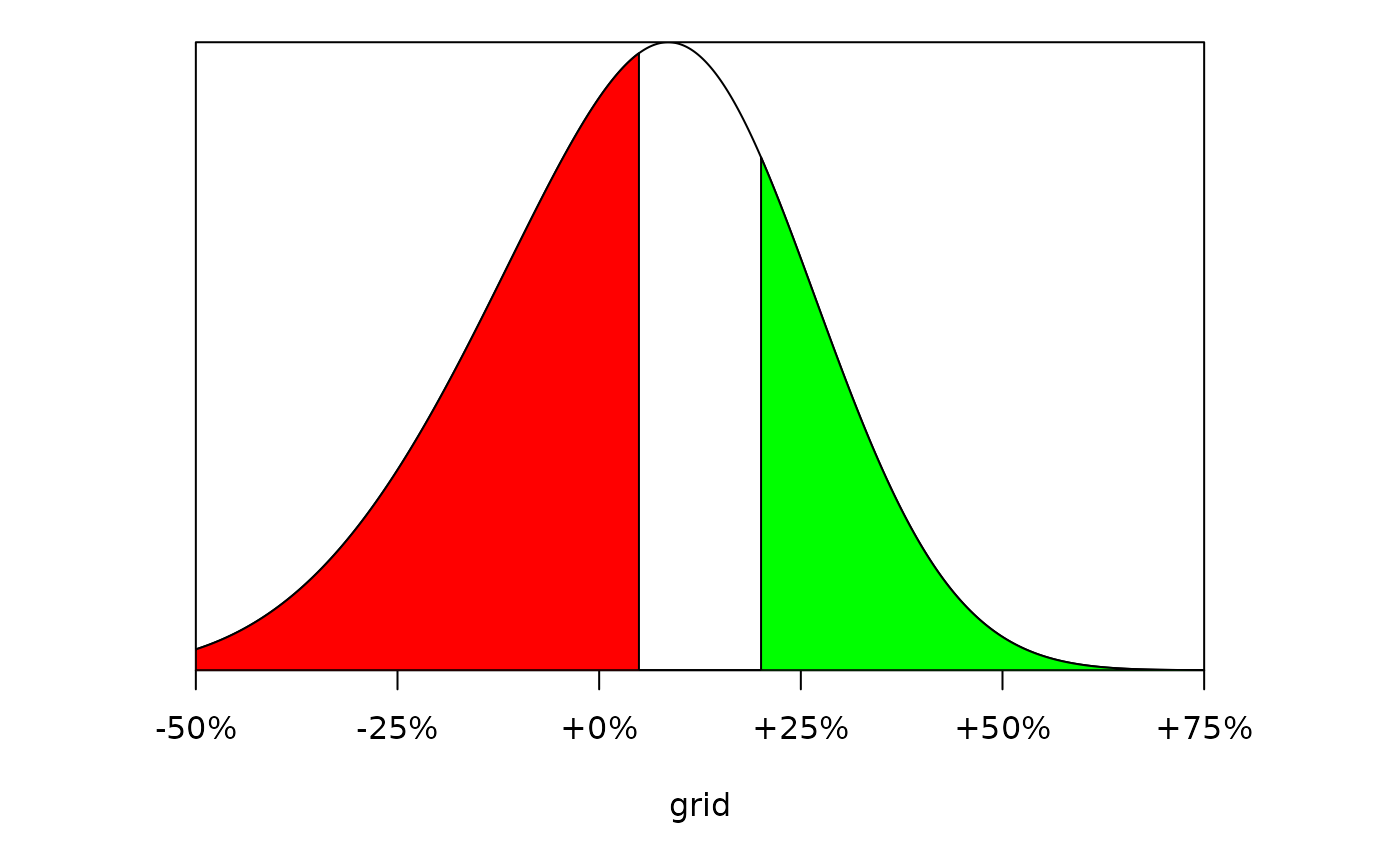
This function will plot the PDF of a difference between two Beta distributions
Arguments
- parY
non-negative parameters of the treatment Beta distribution.
- parX
non-negative parameters of the historical control Beta distribution
- cut_B
a meaningful improvement threshold
- cut_W
a poor improvement throshold
- shade
paint the two areas under the curve, default value=1 as "yes". other numbers stands for "no";
- note
show values of the colored area, default value=1 as "yes". other numbers stands for "no"
- ...
additional arguments to
plot
Examples
myPlotDiff(
  parY = c(5, 10),
  parX = c(2, 5),
  cut_B = 0.2, # a meaningful improvement threshold
  cut_W = 0.05, # a poor improvement threshold
  shade = 1, # paint the two areas under the curve, default: yes. other numbers stands for "no";
  note = 0
) # show values of the colored area, default: yes. other numbers stands for "no";