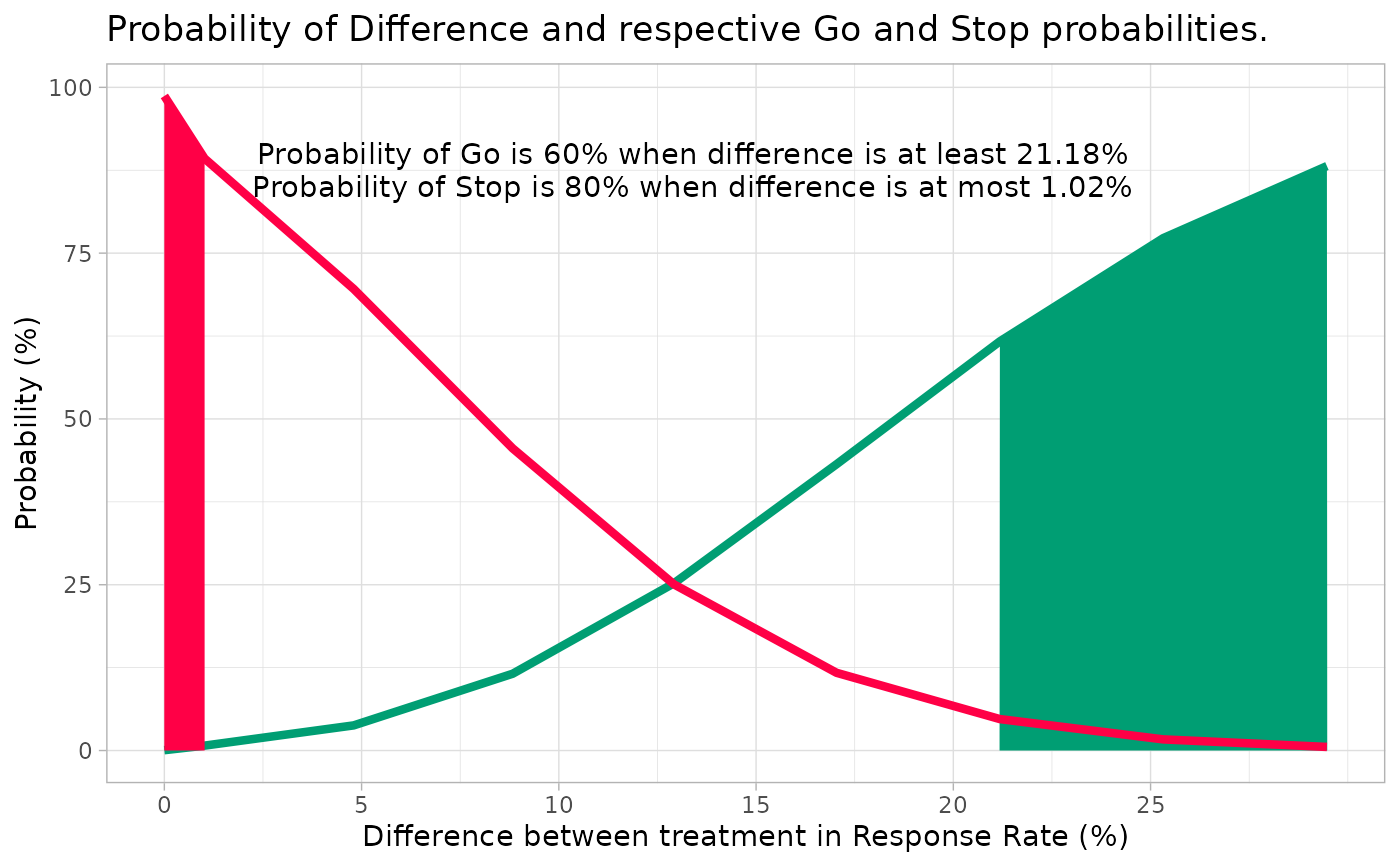
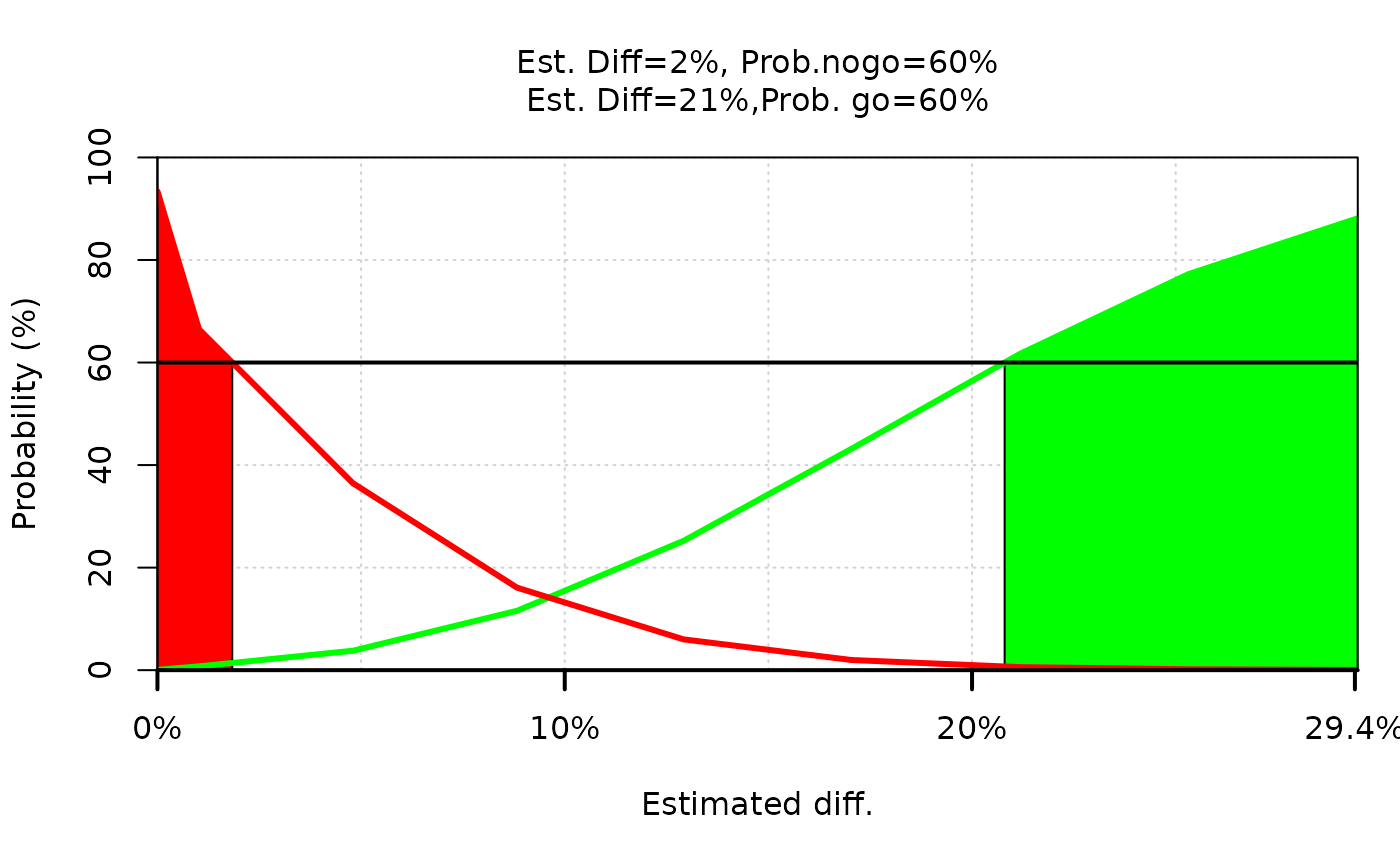
This function will return a plot showing a curve of the probability of a meaningful improvement over estimated diff and a curve of the probability of a poor improvement over estimated diff
Arguments
- data
(
data.frame):
fromsumTable()- efficacious_prob
(
number):
a cut off for the probability of a meaningful improvement- futile_prob
(
number):
a cut off for the probability of a poor improvement
Value
ggplot2::ggplot() object
Examples
summaries <- do.call(
  cbind,
  lapply(c(0:8),
    sumTable,
    n = 25,
    parX = c(1, 52),
    go_cut = 0.2,
    stop_cut = 0.05
  )
)

plotDecision(summaries, efficacious_prob = 60, futile_prob = 60)


# plotting different criteria
summaries <- do.call(
  cbind,
  lapply(c(0:8),
    sumTable,
    n = 25,
    parX = c(1, 52),
    # density when P( diff > 20% | B(1, 52) for control and B(0.5, 0.5) for treatment) :
    go_cut = 0.2,
    # density when P( diff < 10% | B(1, 52) for control and B(0.5, 0.5) for treatment) :
    stop_cut = 0.1
  )
)

plotDecision(summaries, efficacious_prob = 60, futile_prob = 80)
# plotting different criteria
summaries <- do.call(
cbind,
lapply(c(0:8),
sumTable,
n = 25,
parX = c(1, 52),
# density when P( diff > 20% | B(1, 52) for control and B(0.5, 0.5) for treatment) :
go_cut = 0.2,
# density when P( diff < 10% | B(1, 52) for control and B(0.5, 0.5) for treatment) :
stop_cut = 0.1
)
)
plotDecision(summaries, efficacious_prob = 60, futile_prob = 80)