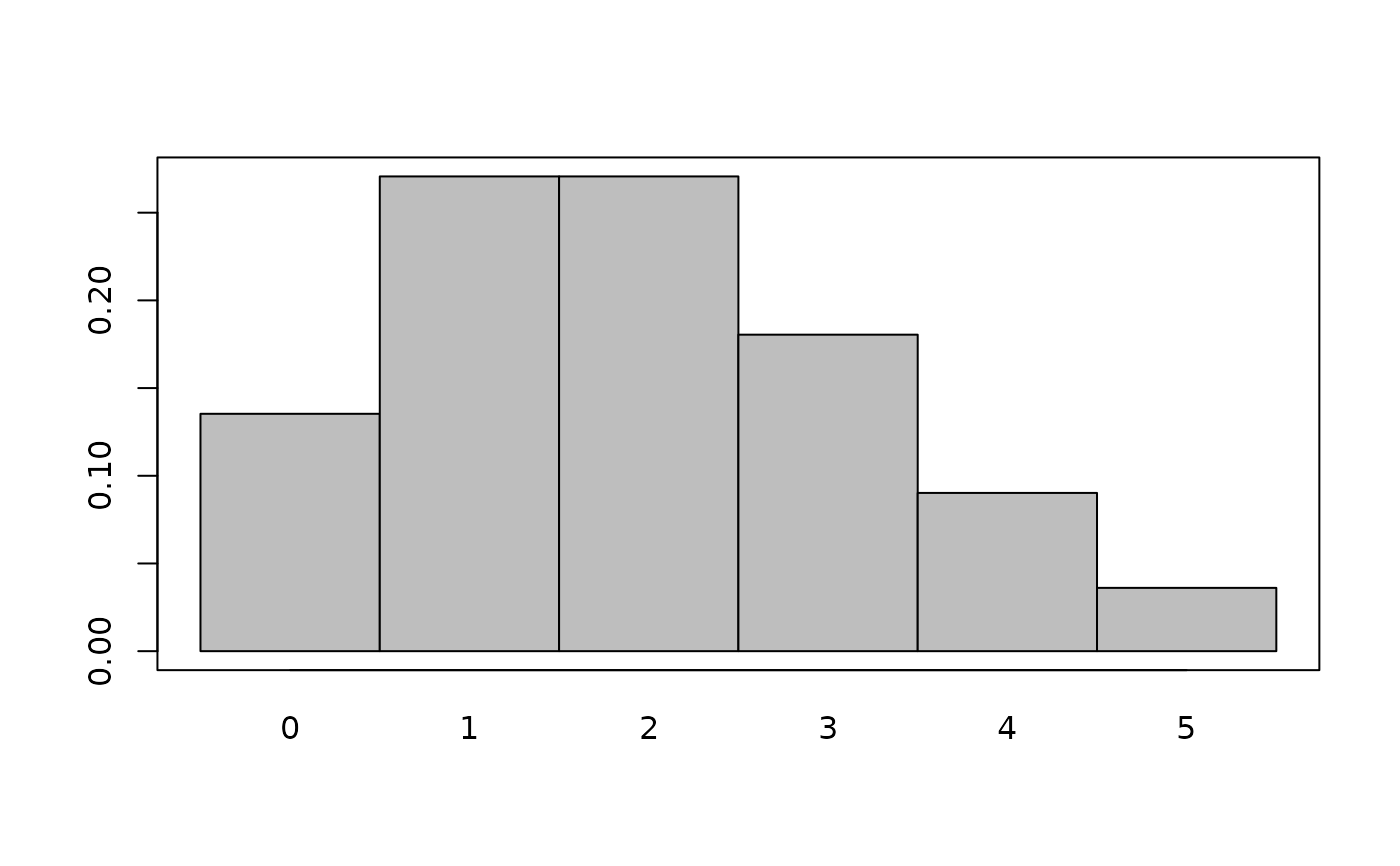
Plot Probability Mass Function Values
Usage
plot_pmf(x, y, ..., col = "grey", add = FALSE)
Arguments
- x
values
- y
probability mass values y = f(x)
- ...
passed to plot() and rect()
- col
Fill color of bars.
- add
Add bars to existing plot.
Plots the probability values as a barplot.
Value
No return value, this function generates a plot in the current graphics device.
Examples
x <- seq(0, 5)
y <- dpois(x, lambda = 2)
plot_pmf(x, y)
