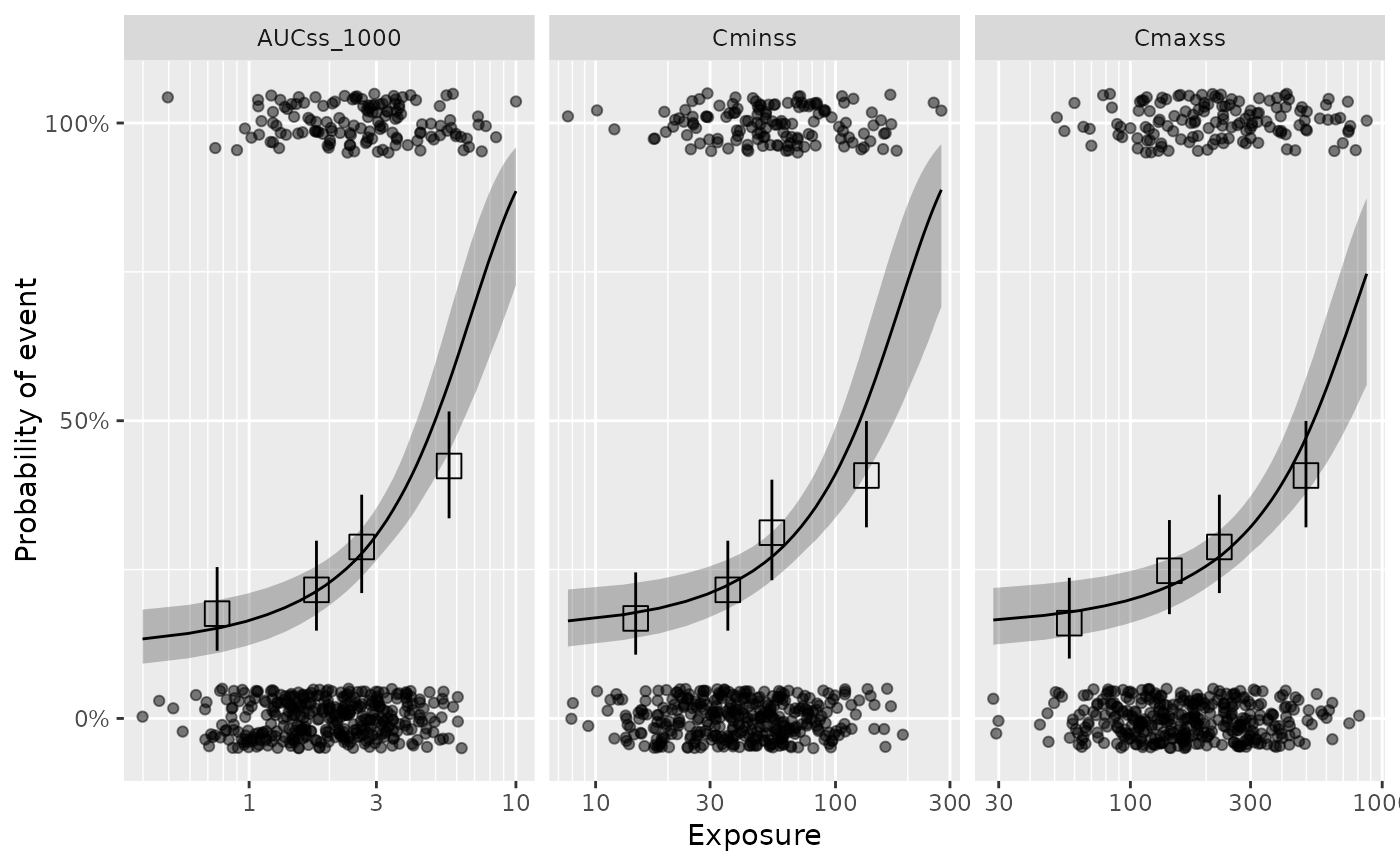
Plot exposure metric selection comparison
plot_er_exp_sel.RdPlot ER curve for each exposure metric and compare them.
Examples
# \donttest{
data(d_sim_binom_cov_hgly2)

ermod_bin_exp_sel <-
  dev_ermod_bin_exp_sel(
    data = d_sim_binom_cov_hgly2,
    var_resp = "AEFLAG",
    var_exp_candidates = c("AUCss_1000", "Cmaxss", "Cminss")
  )
#> ℹ The exposure metric selected was: AUCss_1000

plot_er_exp_sel(ermod_bin_exp_sel) +
  xgxr::xgx_scale_x_log10(guide = ggplot2::guide_axis(minor.ticks = TRUE))

# }
# }