Tutorial 3: Integrating Attributions#
This first part of this tutorial shows how to generate new attribution scores using integrated gradients and SCimilarity.
The second section details how to integrate new attributions with pre-computed attributions
Before running this tutorial, you need to:
Download the model files folder from here
Download the cell type-level attributions you are interested in from here. For this tutorial, you can download the relevant attributions from here. The file can be extracted by running “tar -xzf celltype_attributions.tar.gz”. This will produce the “celltype_attributions” folder needed for the tutorial below.
[1]:
import os
from os.path import join
import pandas as pd
import scanpy as sc
from scipy import sparse

from SIGnature import Meta
from tqdm import tqdm
import warnings

warnings.filterwarnings("ignore")
Part 1: Generate Attributions for New Data#
Load SCimilarity Model and Attributions TileDB#
[2]:
from SIGnature.models.scimilarity import SCimilarityWrapper

base_model_fold = "home/model_files/" # change to path where model_files was downloaded
model_path = join(base_model_fold, "scimilarity")
scim = SCimilarityWrapper(model_path=model_path, use_gpu=True) # change to use_gpu=False if no GPU available
[3]:
# Load custom data
base_folder = "home" # change to base folder of your data
data_file = join(base_folder, "tutorial_dataset.h5ad") # change to path of your data file
adata = sc.read_h5ad(data_file)
Calculate Attributions using SCimilarity and Integrated Gradients#
Attributions collected against SCimilarity model need to be aligned to SCimilarity gene order and then log-normalized.
[4]:
tadata = scim.preprocess_adata(adata.copy())
[5]:
# replace "ig" (integrated gradients) with "dl" (deeplift) or "ixg" (input x gradients) for other methods.
# save attributions with npz_path parameter
npz_file = "custom_attributions.npz"
att = scim.calculate_attributions(
    tadata.X, batch_size=100, method="ig", npz_path=join(base_folder, npz_file)
)
100%|██████████| 6/6 [00:01<00:00, 5.09it/s]
[6]:
## save attributions if not saved above using npz_path parameter
# npz_file = "custom_attributions.npz"
# sparse.save_npz(matrix=att, file=join(base_folder, npz_file))
Part 2: Integrate new data with pre-computed attributions#
Create a tiledb for integrating with known matrices#
[7]:
from SIGnature import SIGnature
[8]:
## Overwrite will take tiledb with the same name [custom_tiledb] and overwrite it with your new one
sig = SIGnature(gene_order=scim.gene_order)
sig.create_tiledb(
    npz_path=join(base_folder, npz_file),
    overwrite=True,
    attribution_tiledb_uri=join(base_folder, "custom_attributions"),
)
Optimizing /gpfs/scratchfs01/site/u/goldm3/signature_revision/custom_attributions
Fragments before consolidation: 1
Fragments after consolidation: 1
Search existing tiledbs and new tiledb#
[9]:
## Path to cell type attributions downloaded from Zenodo (https://zenodo.org/records/17905668)
ct_base = join(base_folder, "celltype_attributions/")
all_ct = os.listdir(ct_base)
[10]:
# Analyze all monocyte/macrophage cell populations in database
ctoi = [
    "alveolar macrophage",
    "classical monocyte",
    "intermediate monocyte",
    "macrophage",
    "non-classical monocyte",
]
Check genes#
[11]:
ms1_genes = ['S100A8', 'S100A12', 'RETN', 'CLU', 'MCEMP1', 'IL1R2', 'CYP1B1', 'SELL',
             'ALOX5AP', 'SLC39A8', 'PLAC8', 'ACSL1', 'CD163', 'VCAN', 'HP', 'CTSD',
             'LGALS1', 'THBS1', 'CES1', 'S100P', 'ANXA6', 'VNN2', 'NAMPT', 'HAMP',
             'DYSF', 'SDF2L1', 'NFE2', 'SLC2A3', 'BASP1', 'ADGRG3', 'SOD2', 'CTSA',
             'PADI4', 'CALR', 'SOCS3', 'NKG7', 'FLOT1', 'IL1RN', 'ZDHHC19', 'LILRA5',
             'ASGR2', 'FAM65B', 'MNDA', 'STEAP4', 'NCF4', 'LBR', 'RP11-295G20.2',
             'UBR4', 'PADI2', 'NCF1', 'LINC00482', 'RUNX1', 'RRP12', 'HSPA1A',
             'FLOT2', 'ANPEP', 'CXCR1', 'ECE1', 'ADAM19', 'RP11-196G18.3', 'IL4R',
             'DNAJB11', 'FES', 'MBOAT7', 'SNHG25', 'RP1-55C23.7', 'CPEB4', 'PRR34-AS1',
             'HSPA1B', 'LINC01001', 'C1QC', 'SBNO2', 'GTSE1', 'FOLR3', 'STAB1', 'PLK1',
             'HYI-AS1', 'LINC01281', 'TNNT1', 'AC097495.2', 'CTB-35F21.5', 'C19orf35',
             'AC109826.1', 'RP11-800A3.7', 'LILRA6', 'PDLIM7', 'NPLOC4', 'C15orf48',
             'APOBR', 'CSF2RB', 'CTD-2105E13.14', 'C1QB', 'RP11-123K3.9', 'IQGAP3',
             'GAPLINC', 'CTC-490G23.2', 'JAK3', 'CTC-246B18.10', 'MYO5B']
gene_list = sig.check_genes(ms1_genes)
The following genes are not included: CTC-246B18.10, RP1-55C23.7, C19orf35, RP11-295G20.2, RP11-196G18.3, CTD-2105E13.14, CTB-35F21.5, RP11-123K3.9, AC097495.2, RP11-800A3.7, CTC-490G23.2, HYI-AS1, FAM65B
Calculate mean attribution scores for each Cell Type#
Iterate through tiledb of each cell type, calculate score, concatenate the metadata
[12]:
score_name = "MS1"
[13]:
meta_list = []
for ct in tqdm(ctoi):
    ## Get specific tiledb path for location of interest
    ct_path = join(ct_base, ct)
    ## Load attributions tiledb path for given cell type
    att_tdb_path = join(ct_path, "attributions")
    ## Calculate
    results = sig.query_attributions(
        gene_list,
        return_aggregate=True,
        aggregate_type="mean",
        attribution_tiledb_uri=att_tdb_path,
    )

    ## Example including weights
    # import numpy as np
    # weight_list = np.random.choice([0.5, 1, 2], len(gene_list)).tolist()
    # results = sig.query_attributions(gene_list, return_aggregate=True,
    #               aggregate_type='mean', weights = weight_list,
    #               attribution_tiledb_uri=att_tdb_path)

    ## Example getting individual genes
    # results = sig.query_attributions(gene_list, return_aggregate=False,
    #               attribution_tiledb_uri=att_tdb_path)

    ## Load corresponding cell metadata
    ct_path = join(ct_base, ct)
    meta = pd.read_csv(join(ct_path, "cell_metadata.csv.gz"), index_col=0)

    ## Put score
    meta[score_name] = results
    meta_list.append(meta.copy())
100%|██████████| 5/5 [00:22<00:00, 4.51s/it]
Create Meta object with cell metadata and mean attribution scores#
[14]:
big_meta = pd.concat(meta_list)
momac_meta = Meta(big_meta)
# subset to in vivo cells
momac_meta.subset_invivo()
# subset to cells with high prediction scores
momac_meta.subset_hq()
[15]:
## Calculate mean attributions for new dataset
results = sig.query_attributions(
    gene_list,
    return_aggregate=True,
    aggregate_type="mean",
    attribution_tiledb_uri=join(base_folder, "custom_attributions"),
)

## Load corresponding cell metadata
nmeta = adata.obs

## Put score
nmeta[score_name] = results
Integrate datasets and clean disease names#
[16]:
momac_meta.append(nmeta)
[17]:
figure_disname_dict = {
    "atopic eczema": "Atopic Dermatitis",
    "COVID-19;healthy": "COVID-19 & Healthy (Mixed)",
    "Epstein-Barr virus infection;hemophagocytic syndrome": "EBV-Associated HLH",
    "Immune dysregulation-polyendocrinopathy-enteropathy-X-linked syndrome": "IPEX",
    "mucocutaneous lymph node syndrome": "Kawasaki Disease",
    "systemic scleroderma;interstitial lung disease": "SSC-ILD",
    "thrombocytopenia": "Severe Fever Thrombocytopenia Syndrome",
}

momac_meta.df["disease"] = momac_meta.df["disease"].replace(figure_disname_dict)
Calculate hit percentage per sample#
[19]:
# Define hits
hit_col = "MS1"
## 90th percentile
momac_meta.add_hits(
    column_name=hit_col,
    mode="percentile",
    cut_val=90,
    hit_type="above",
    string_append="__hit90p",
)
[20]:
# calculate hits per sample. Only consider samples with at least 10 cells and diseases with at least 3 samples
samphit_df_90 = momac_meta.samphit_df(
    cell_min=10, samp_min=3, hit_col="MS1__hit90p", num_dis=100
)
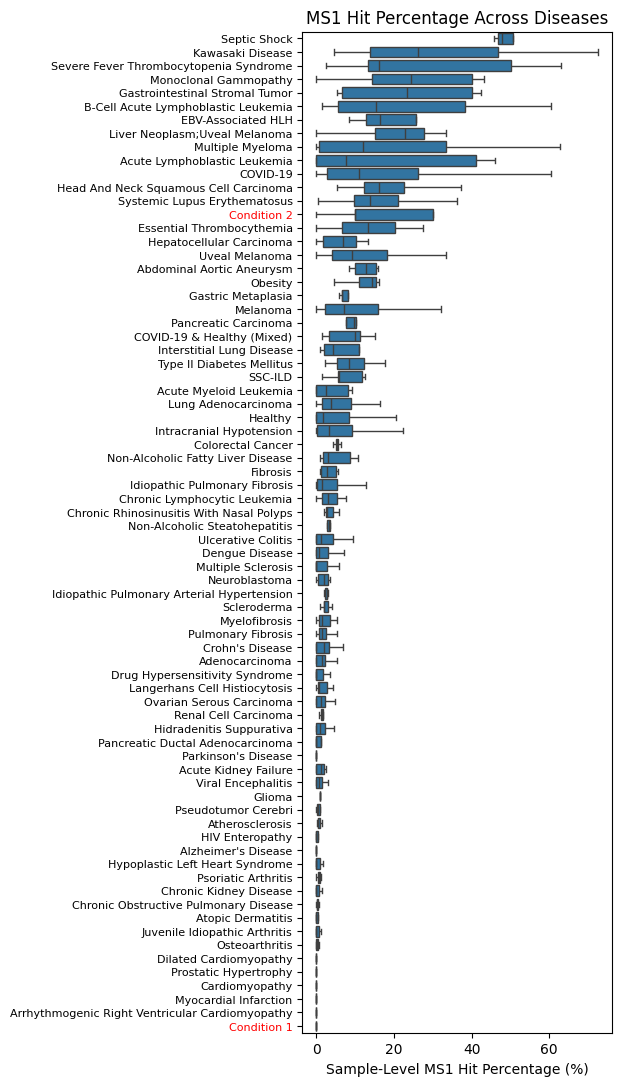
Plot top diseases by mean hit percentage#
Condition 2 (initialized with MS1-like cells) shows high levels, but Condition 1 (which was initialized random counts) is very low.
[21]:
import seaborn as sns
import matplotlib.pyplot as plt

fig, ax = plt.subplots(figsize=(4, 13))
sns.boxplot(data=samphit_df_90, y="disease", x="MS1__hit90p", showfliers=False)
ax.set_yticklabels(ax.get_yticklabels(), ha="right", fontsize=8)

for label in ax.get_yticklabels():
    if label.get_text() in ["Condition 1", "Condition 2"]:
        label.set_color("red")
ax.set_title("MS1 Hit Percentage Across Diseases")
ax.set_xlabel("Sample-Level MS1 Hit Percentage (%)")
ax.set_ylabel("")

x_ticks = ax.get_xticks() * 100
ax.set_xticklabels([f"{int(y)}" for y in x_ticks]);