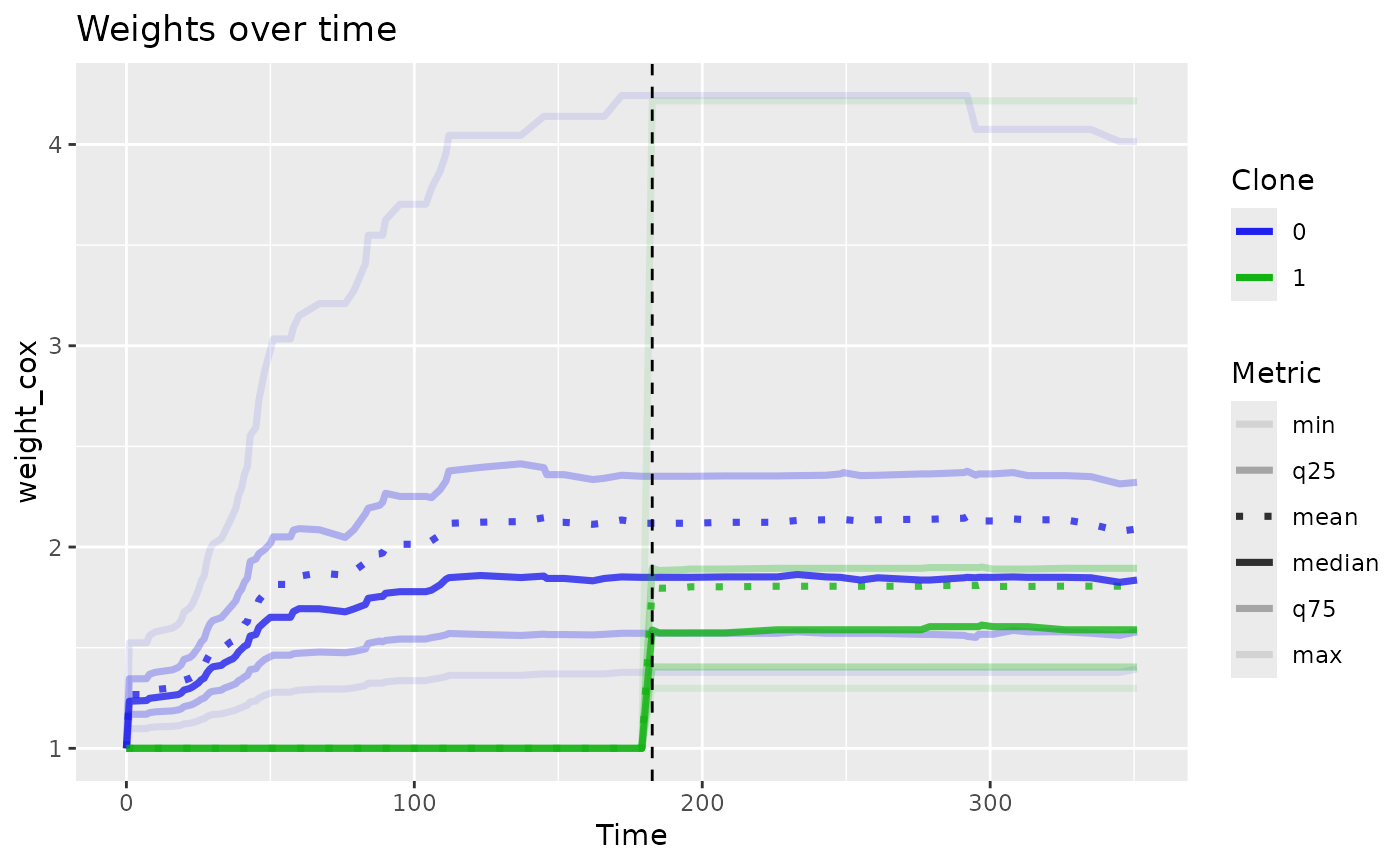
Visualize weights and variables over time
plot_ccw_over_time.RdVisualize weights and variables over time
plot_ccw_over_time(df)Arguments
- df
A data.frame with one row per clone per observation period that contains weights for each patient-period as returned by
generate_ccw()
Value
a ggplot2 object
Examples
# Load the toy dataset
data(dummy_data)

# Create clones
clones <- create_clones(dummy_data,
                        id = "id",
                        event = "event",
                        time_to_event = "timetoevent",
                        exposure = "exposure",
                        time_to_exposure = "timetoexposure",
                        ced_window = 100)
#> Updating 4 patients' exposure and time-to-exposure based on CED window

clones_long <- cast_clones_to_long(clones)
clones_long_w <- generate_ccw(clones_long, predvars = c("cov1"))
plot_ccw_over_time(clones_long_w)