
simple_model <- JointModel(
    longitudinal = LongitudinalRandomSlope(),
    survival = SurvivalWeibullPH(),
    link = linkDSLD()
)Introduction
The jmpost package is used to fit joint models of time-to-event endpoints with an association term parameterised from a longitudinal submodel. The package was originally designed for the context of fitting tumour growth inhibition models to inform overall survival but is not limited to this application.
It is important to note that jmpost is just a wrapper on top of the Stan programming language and leans heavily on the wider Stan ecosystem. For example no model diagnostics are provided by jmpost with users being recommended to use packages like bayesplot for this functionality.
This vignette provides a basic outline of how to fit a joint model using jmpost. For more detailed information on the package and its functions please refer to the package documentation.
Model Specification
Each JointModel needs to be specified with three parts:
-
longitudinal: The model for the longitudinal outcomes. -
survival: The model for the survival outcomes. -
link: The link that specifies how thelongitudinalmodel parameters enter thesurvivalmodel.
Default Options
Let’s first specify a very simple joint model with:
- A random slope model for the longitudinal outcome.
- A Weibull proportional hazards model for the survival outcome.
- The link between the two models is that the random slope from the longitudinal model enters as a product with a link coefficient into the linear predictor of the survival model.
Note that here we use all the default options for the two models and the link, in particular the prior distributions and the initial values in the MCMC chain for the parameters are automatically chosen. We can see this from the arguments of the constructors (or from the help page):
args(LongitudinalRandomSlope)
#> function (intercept = prior_normal(30, 10), slope_mu = prior_normal(1,
#>     3), slope_sigma = prior_lognormal(0, 1.5), sigma = prior_lognormal(0,
#>     1.5), scaled_variance = FALSE)
#> NULL
So here we see that the Longitudinal Random Slope model has 4 parameters that we can define a prior for.
Specifying Priors
We can alternatively also specify the prior distributions for the parameters manually. This is important in practice to obtain a meaningful model specification and hence converging MCMC chains that allow to estimate the posterior distributions.
For the random slope model for the longitudinal outcome, we can e.g. say:
random_slope_model <- LongitudinalRandomSlope(
    intercept = prior_normal(40, 5),
    slope_mu = prior_normal(10, 2)
)
This sets the prior for the intercept to be a distribution and the prior for the slope_mu parameter to be a distribution.
For the survival models, we can set different independent normal priors for the coefficients of the covariates in the linear predictor using the prior_normal_vector() specification. Here we can give a vector of the same length as the number of design matrix columns for both the means or standard deviations of the normal distributions, or we can give a single value that will be repeated for all covariates. For example, say we have 3 design matrix columns, i.e. coefficients, in the linear predictor of the survival model, then we can set the priors for these coefficients as follows:
survival_model <- SurvivalWeibullPH(
    beta = prior_normal_vector(mus = c(-1, 0, 5), sigmas = c(1, 1, 10))
)
survival_model
#>
#> Weibull-PH Survival Model with parameters:
#>     sm_weibull_ph_lambda ~ gamma(alpha = 2, beta = 0.5)
#>     sm_weibull_ph_gamma ~ gamma(alpha = 2, beta = 0.5)
#>     beta_os_cov ~ normal(mus = [-1, 0, 5], sigmas = [1, 1, 10])
In order to know which position corresponds to which design matrix column and thus coefficient, we can use the model.matrix() function on the DataSurvival object. This is explained in the section “Formatting Data” below in detail.
Priors on a transformed scale
Sometimes prior information is available on a different scale from the model parameter. Use transform to specify the mapping from the model parameter to the prior density scale. For example, sigma is a residual standard deviation, so a prior on its variance can be specified as follows:
variance_prior_model <- LongitudinalRandomSlope(
    sigma = prior_normal(100, 100, transform = prior_transform_square())
)
Here sigma^2 has a normal distribution restricted to positive values. jmpost includes the Jacobian and maps model-imposed bounds to the variance scale when normalising the truncated density. The square transformation uses the positive branch and restricts the declared parameter to non-negative values.
For log-scale intercepts, use prior_transform_exp(): for example, prior_normal(60, 60, transform = prior_transform_exp()) places the normal prior on the exponential of the intercept. Use prior_transform_exp(scale = 2) for a prior on exp(2 * intercept), such as a variance when the intercept is a log standard deviation. These transformations change the prior; they are independent of covariate predictor parametrizations.
The same specification can be written with a wrapper:
variance_prior <- prior_transform(
    prior_normal(100, 100), prior_transform_square()
)
Both forms support scalar distribution helpers, including prior_normal() and prior_invgamma(). A scalar distribution is applied independently to each component of a vector parameter. Vector-specific helpers such as prior_normal_vector() and the horseshoe prior do not accept transformations. Initial values are drawn on the density scale within the mapped bounds, inverse-transformed and then shrunk on the model parameter scale.
Flat priors
Use prior_flat() to add no prior density term on the declared parameter scale. Its init distribution only supplies initial values:
flat_coefficient_model <- SurvivalWeibullPH(
    beta = prior_flat(init = prior_normal(0, 1))
)
Model-imposed bounds still apply. An unbounded flat prior is improper, and a proper posterior is not guaranteed. A flat prior is specific to its scale: flat on a log coefficient does not imply flat on its exponential.
Separate Models
It is also possible to not link the longitudinal and the survival models, by using the special linkNone() link specification. For example,
simple_model_no_link <- JointModel(
    longitudinal = LongitudinalRandomSlope(),
    survival = SurvivalWeibullPH(),
    link = linkNone()
)
would allow to fit the two models separately, but in the same MCMC chain.
Single Models
It is also possible to specify only the longitudinal or the survival model. Then these can be estimated on their own with separate MCMC chains.
single_longitudinal <- JointModel(
    longitudinal = LongitudinalRandomSlope()
)
single_survival <- JointModel(
    survival = SurvivalWeibullPH()
)
Data Preparation
Before we can fit the models, we need to prepare the data in the right format.
Simulating Data
Here we start from a simulated data set.
- We assign 50 subjects each to the two treatment arms.
- We use a time grid from 1 to 2000, e.g. specifying the days after randomization.
- We use an exponentially distributed censoring time with mean of 9000 days.
- We use a categorical covariate with three levels A, B and C in the overall survival model, drawn uniformly from the three levels. (Note that this is hardcoded at the moment, so the levels need to be A, B, C.)
- We use another continuous covariate in the overall survival model generated from a standard normal distribution, with coefficient 0.3.
- For the longitudinal outcome, we draw the values from a random slope model with the given parameters.
- For the survival outcome, we draw the true value from a Weibull model. Note that it is fairly easy to put here another choice, you just need to specify a function of
timereturning the log baseline hazard under the given survival model.
So let’s run the code for that:
set.seed(129)
sim_data <- SimJointData(
    design = list(
        SimGroup(50, "Arm-A", "Study-X"),
        SimGroup(50, "Arm-B", "Study-X")
    ),
    longitudinal = SimLongitudinalRandomSlope(
        times = c(1, 20, 50, 100, 150, 200, 250, 300),
        intercept = 30,
        slope_mu = c(1, 2),
        slope_sigma = 0.2,
        sigma = 20,
        link_dsld = 0.1
    ),
    survival = SimSurvivalWeibullPH(
        lambda = 1 / 300,
        gamma = 0.97,
        time_max = 2000,
        time_step = 1,
        lambda_cen = 1 / 9000,
        beta_cat = c(
            "A" = 0,
            "B" = -0.1,
            "C" = 0.5
        ),
        beta_cont = 0.3
    )
)
We might get a message here that a few subjects did not die before the day 2000, but this is not of concern. Basically it just gives us a feeling of how many survival events are included in the data set.
Formatting Data
Next we bring the data into the right format.
We start with extracting data into individual data sets, and then reducing the longitudinal data to specific time points.
os_data <- sim_data@survival
long_data <- sim_data@longitudinal
Let’s have a quick look at the format:
The survival data has:
- subject ID
- time point
- continuous covariate value
- categorical covariate level
- event indicator (1 for observed, 0 for censored)
- study ID
- treatment arm
head(os_data)
#> # A tibble: 6 × 7
#>   subject     study   arm    time cov_cont cov_cat event
#>   <chr>       <fct>   <fct> <dbl>    <dbl> <fct>   <dbl>
#> 1 subject_001 Study-X Arm-A    35   -1.12  B           1
#> 2 subject_002 Study-X Arm-A    17   -0.990 C           1
#> 3 subject_003 Study-X Arm-A   876   -1.37  C           1
#> 4 subject_004 Study-X Arm-A   100   -1.36  C           1
#> 5 subject_005 Study-X Arm-A     9    2.00  B           1
#> 6 subject_006 Study-X Arm-A   122    0.696 B           1
The longitudinal data has:
- subject ID
- time point
- sum of longest diameters (SLD)
- study ID
- treatment arm
- observation flag
head(long_data)
#> # A tibble: 6 × 6
#>   subject     arm   study    time   sld observed
#>   <chr>       <fct> <fct>   <dbl> <dbl> <lgl>
#> 1 subject_001 Arm-A Study-X     1  23.4 TRUE
#> 2 subject_001 Arm-A Study-X    20  75.3 TRUE
#> 3 subject_001 Arm-A Study-X    50  83.1 FALSE
#> 4 subject_001 Arm-A Study-X   100  86.8 FALSE
#> 5 subject_001 Arm-A Study-X   150 166.  FALSE
#> 6 subject_001 Arm-A Study-X   200 271.  FALSE
Finally, we wrap these in the data formatting functions. Here the mapping of the column names to the required variables happens. This means that in our applications we don’t have to use the same variable names as seen above, but we can use custom names and then apply the mapping here.
joint_data <- DataJoint(
    subject = DataSubject(
        data = os_data,
        subject = "subject",
        arm = "arm",
        study = "study"
    ),
    survival = DataSurvival(
        data = os_data,
        formula = Surv(time, event) ~ cov_cat + cov_cont
    ),
    longitudinal = DataLongitudinal(
        data = long_data,
        formula = sld ~ time,
        threshold = 5
    )
)
Note that we can also actively look into the design matrix of the DataSurvival object. This can be helpful if we want to know which coefficients are at which position, e.g. for setting the right prior means and standard deviations with prior_normal_vector(). It works like this:
head(model.matrix(joint_data@survival))
#>      cov_catB cov_catC   cov_cont
#> [1,]        1        0 -1.1209000
#> [2,]        0        1 -0.9897245
#> [3,]        0        1 -1.3746970
#> [4,]        0        1 -1.3556451
#> [5,]        1        0  1.9967553
#> [6,]        1        0  0.6958700
So here we see that the first coefficient corresponds to category B and the second coefficient corresponds to category C of the categorical covariate cov_cat, while the third coefficient corresponds to the continuous covariate cov_cont.
Model Fitting
Now let’s have a look how we can fit the (joint) models.
Debugging Stan Code
It is always possible to read out the Stan code that is contained in the JointModel object, using write_stan():
tmp <- tempfile()
write_stan(simple_model, destination = tmp)
first_part <- head(readLines(tmp), 10)
cat(paste(first_part, collapse = "\n"))
#> functions {
#>     //
#>     // Source - base/functions.stan
#>     //
#>
#>     // Constant used in below.
#>     real neg_log_sqrt_2_pi() {
#>         return -0.9189385332046727;
#>     }
Sampling Parameters
Finally, sampleStanModel() is kicking off the MCMC sampler via cmdstanr in the backend. Note that in practice you would increase the number of warm-up and sampling iterations.
mcmc_results <- sampleStanModel(
    simple_model,
    data = joint_data,
    iter_sampling = 500,
    iter_warmup = 500,
    chains = 1,
    parallel_chains = 1
)
#> Running MCMC with 1 chain...
#>
#> Chain 1 Iteration:   1 / 1000 [  0%]  (Warmup)
#> Chain 1 Informational Message: The current Metropolis proposal is about to be rejected because of the following issue:
#> Chain 1 Exception: gamma_lpdf: Random variable is 0, but must be positive finite! (in '/tmp/RtmpvFkRox/model-168b3742800.stan', line 548, column 4 to column 100)
#> Chain 1 If this warning occurs sporadically, such as for highly constrained variable types like covariance matrices, then the sampler is fine,
#> Chain 1 but if this warning occurs often then your model may be either severely ill-conditioned or misspecified.
#> Chain 1
#> Chain 1 Informational Message: The current Metropolis proposal is about to be rejected because of the following issue:
#> Chain 1 Exception: gamma_lpdf: Random variable is 0, but must be positive finite! (in '/tmp/RtmpvFkRox/model-168b3742800.stan', line 549, column 4 to column 97)
#> Chain 1 If this warning occurs sporadically, such as for highly constrained variable types like covariance matrices, then the sampler is fine,
#> Chain 1 but if this warning occurs often then your model may be either severely ill-conditioned or misspecified.
#> Chain 1
#> Chain 1 Informational Message: The current Metropolis proposal is about to be rejected because of the following issue:
#> Chain 1 Exception: normal_lpdf: Scale parameter[1] is 0, but must be positive! (in '/tmp/RtmpvFkRox/model-168b3742800.stan', line 530, column 4 to line 533, column 6)
#> Chain 1 If this warning occurs sporadically, such as for highly constrained variable types like covariance matrices, then the sampler is fine,
#> Chain 1 but if this warning occurs often then your model may be either severely ill-conditioned or misspecified.
#> Chain 1
#> Chain 1 Iteration: 100 / 1000 [ 10%]  (Warmup)
#> Chain 1 Iteration: 200 / 1000 [ 20%]  (Warmup)
#> Chain 1 Iteration: 300 / 1000 [ 30%]  (Warmup)
#> Chain 1 Iteration: 400 / 1000 [ 40%]  (Warmup)
#> Chain 1 Iteration: 500 / 1000 [ 50%]  (Warmup)
#> Chain 1 Iteration: 501 / 1000 [ 50%]  (Sampling)
#> Chain 1 Iteration: 600 / 1000 [ 60%]  (Sampling)
#> Chain 1 Iteration: 700 / 1000 [ 70%]  (Sampling)
#> Chain 1 Iteration: 800 / 1000 [ 80%]  (Sampling)
#> Chain 1 Iteration: 900 / 1000 [ 90%]  (Sampling)
#> Chain 1 Iteration: 1000 / 1000 [100%]  (Sampling)
#> Chain 1 finished in 16.6 seconds.
Convergence checks
After the sampling finishes, we can inspect the parameter distributions. This is using the cmdstanr functions, because the results element is of class CmdStanMCMC.
vars <- c(
    "lm_rs_intercept",
    "lm_rs_slope_mu",
    "lm_rs_slope_sigma",
    "lm_rs_sigma",
    "link_dsld",
    "sm_weibull_ph_lambda",
    "sm_weibull_ph_gamma",
    "beta_os_cov"
)
cmdstanr::as.CmdStanMCMC(mcmc_results)$summary(vars)
#> # A tibble: 12 × 10
#>    variable        mean   median      sd     mad       q5     q95  rhat ess_bulk
#>    <chr>          <dbl>    <dbl>   <dbl>   <dbl>    <dbl>   <dbl> <dbl>    <dbl>
#>  1 lm_rs_inte…  2.76e+1  2.76e+1 1.08    1.09    25.9     29.3    0.999     281.
#>  2 lm_rs_slop…  1.02e+0  1.02e+0 0.0295  0.0299   0.971    1.07   1.000     642.
#>  3 lm_rs_slop…  1.97e+0  1.97e+0 0.0289  0.0278   1.92     2.02   0.999     875.
#>  4 lm_rs_slop…  2.09e-1  2.07e-1 0.0204  0.0196   0.180    0.245  1.00      639.
#>  5 lm_rs_slop…  2.13e-1  2.11e-1 0.0242  0.0219   0.177    0.254  0.998     786.
#>  6 lm_rs_sigma  1.95e+1  1.94e+1 0.531   0.521   18.6     20.4    1.00      483.
#>  7 link_dsld   -1.43e-2 -1.07e-2 0.205   0.204   -0.349    0.308  1.00      645.
#>  8 sm_weibull…  9.23e-3  7.98e-3 0.00577 0.00402  0.00300  0.0187 1.00      387.
#>  9 sm_weibull…  8.92e-1  8.91e-1 0.0738  0.0712   0.786    1.02   1.00      432.
#> 10 beta_os_co…  3.11e-4 -5.53e-4 0.244   0.243   -0.405    0.393  0.999     512.
#> 11 beta_os_co…  3.25e-1  3.14e-1 0.271   0.264   -0.145    0.760  1.01      414.
#> 12 beta_os_co…  3.64e-1  3.59e-1 0.0981  0.0934   0.208    0.541  1.00      717.
#> # ℹ 1 more variable: ess_tail <dbl>
We can already see here from the rhat statistic whether the MCMC sampler converged - values close to 1 indicate convergence, while values larger than 1 indicate divergence.
In general, convergence is sensitive to the choice of:
- Priors
- Initial values
- Sufficient warm-up iterations
If you don’t achieve convergence, then play around with different choices of the above.
Plotting
We can now proceed towards investigating the results of the MCMC chain with plots.
Trace plots
Using the draws() method on the results element, we can extract the samples in a format that is understood by bayesplot. We can e.g. look at some simple trace plots:
vars_draws <- cmdstanr::as.CmdStanMCMC(mcmc_results)$draws(vars)

library(bayesplot)
#> This is bayesplot version 1.16.0
#> - Online documentation and vignettes at mc-stan.org/bayesplot
#> - bayesplot theme set to bayesplot::theme_default()
#>    * Does _not_ affect other ggplot2 plots
#>    * See ?bayesplot_theme_set for details on theme setting
mcmc_trace(vars_draws)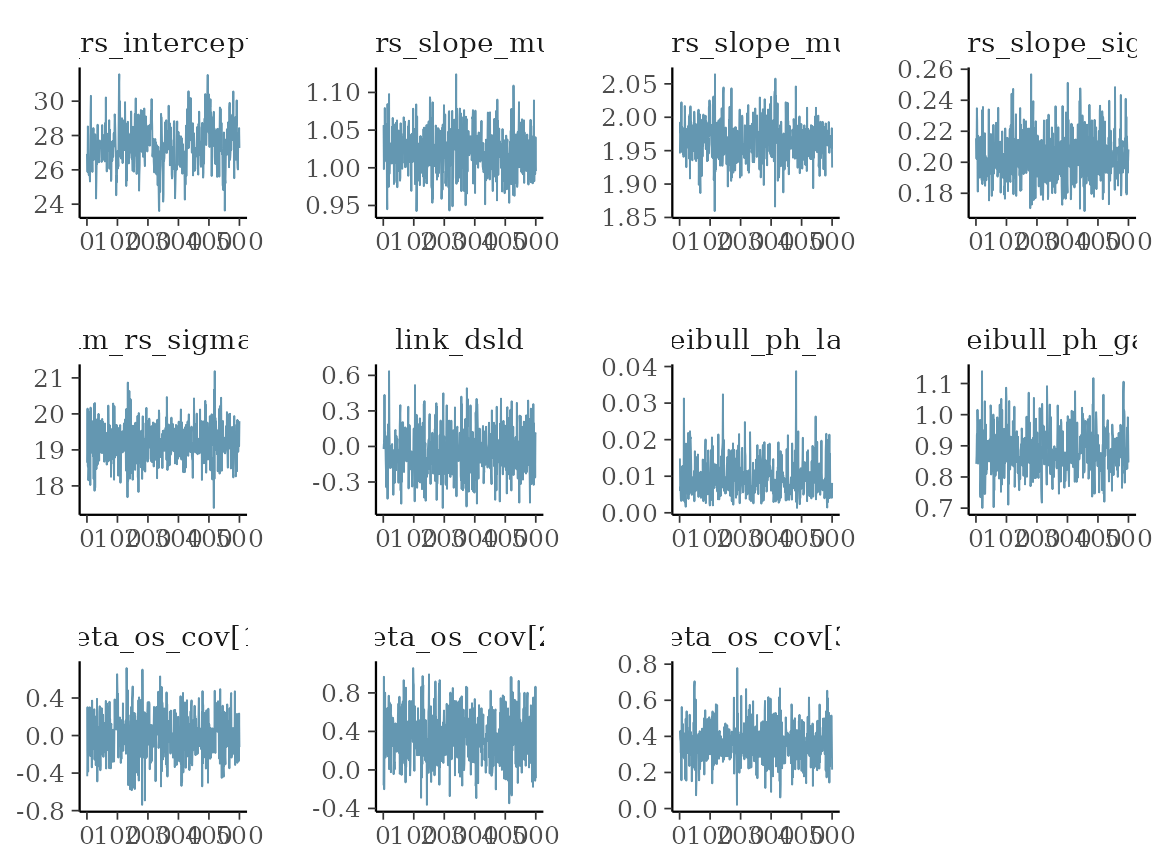
Longitudinal fit plots
Using the longitudinal() method we can extract the longitudinal fit samples from the result, and then plot them for all subjects or those that we are interested in. For illustration, we will plot here the first 10 subjects:
selected_subjects <- head(os_data$subject, 10)
long_quantities <- LongitudinalQuantities(
    mcmc_results,
    grid = GridFixed(
        subjects = selected_subjects
    )
)
as.data.frame(long_quantities) |> head()
#>         group time   values
#> 1 subject_001    0 26.75623
#> 2 subject_001    0 27.41221
#> 3 subject_001    0 26.43415
#> 4 subject_001    0 28.08950
#> 5 subject_001    0 27.20243
#> 6 subject_001    0 26.72683
summary(long_quantities) |> head()
#>         group time   median    lower    upper
#> 1 subject_001    0 27.60525 25.58923 29.74009
#> 2 subject_002    0 27.60525 25.58923 29.74009
#> 3 subject_003    0 27.60525 25.58923 29.74009
#> 4 subject_004    0 27.60525 25.58923 29.74009
#> 5 subject_005    0 27.60525 25.58923 29.74009
#> 6 subject_006    0 27.60525 25.58923 29.74009
autoplot(long_quantities)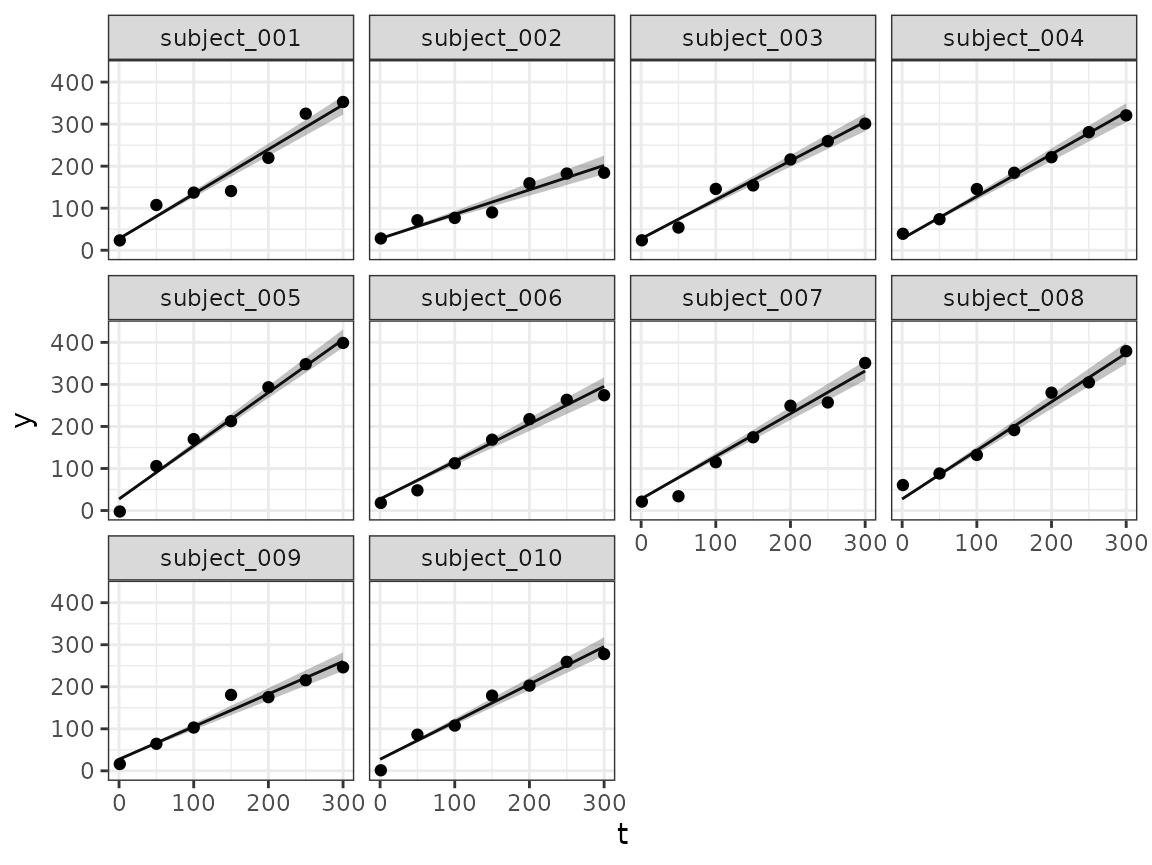
Survival fit plots
And using the SurvivalQuantities() method we can do the same for the estimated survival functions.
surv_quantities <- SurvivalQuantities(
    mcmc_results,
    grid = GridFixed(
        subjects = selected_subjects
    )
)
as.data.frame(surv_quantities) |> head()
#>         group time values
#> 1 subject_001    0      1
#> 2 subject_001    0      1
#> 3 subject_001    0      1
#> 4 subject_001    0      1
#> 5 subject_001    0      1
#> 6 subject_001    0      1
summary(surv_quantities) |> head()
#>         group time median lower upper
#> 1 subject_001    0      1     1     1
#> 2 subject_002    0      1     1     1
#> 3 subject_003    0      1     1     1
#> 4 subject_004    0      1     1     1
#> 5 subject_005    0      1     1     1
#> 6 subject_006    0      1     1     1
autoplot(surv_quantities)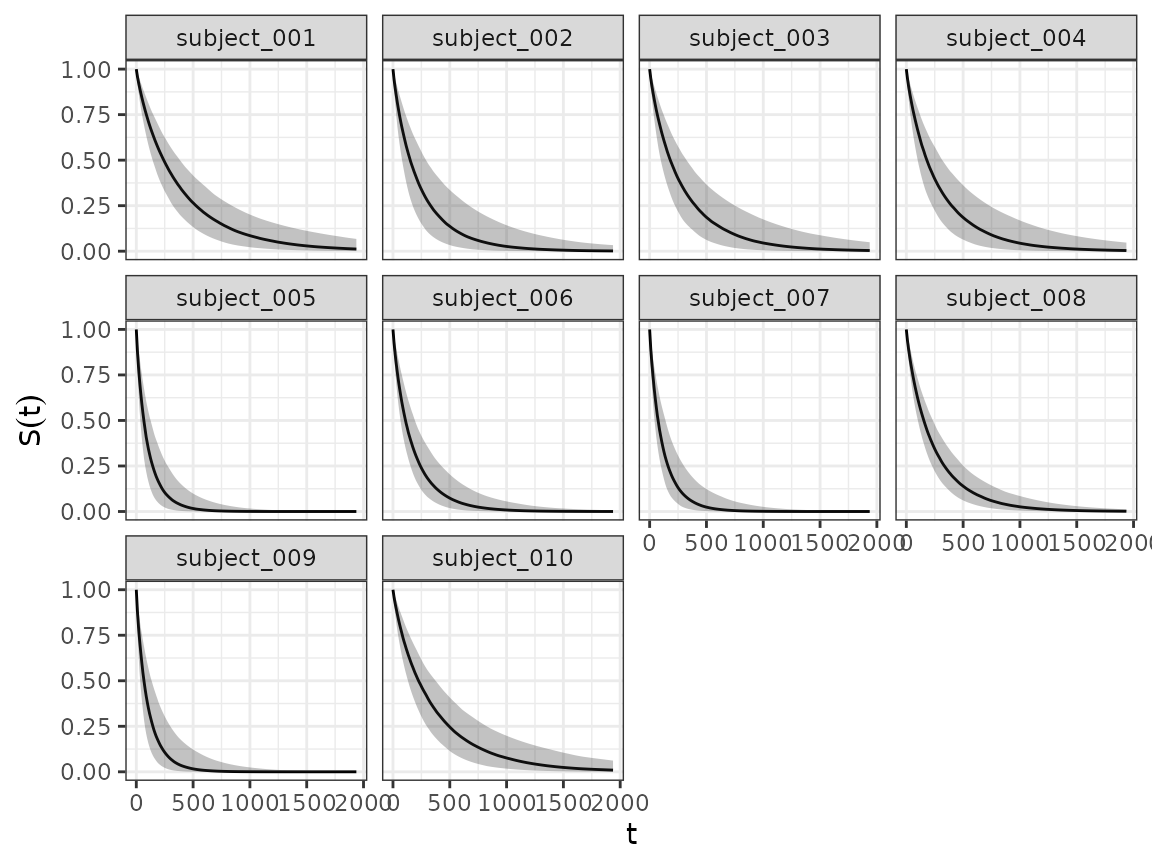
We can also aggregate the estimated survival curves from groups of subjects, using the corresponding method.
surv_quantities <- SurvivalQuantities(
    mcmc_results,
    grid = GridGrouped(
        groups = split(os_data$subject, os_data$arm)
    )
)
autoplot(surv_quantities, add_km = TRUE)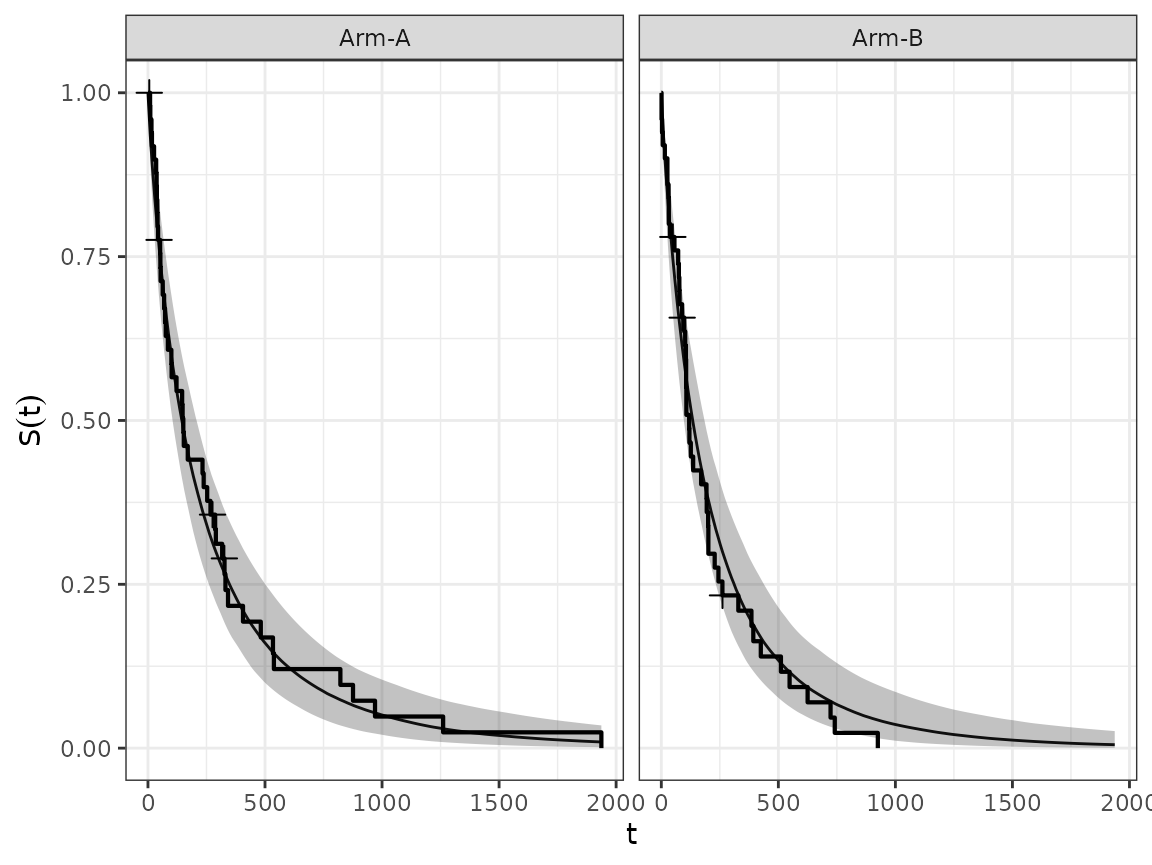
Predicting Survival Quantities for Hypothetical Subjects
The SurvivalQuantities() method can also be used to predict survival quantities for hypothetical subjects with any arbitrary covariate and longitudinal model parameter values. This is done via passing a GridPrediction() object to the method where the newdata and params arguments are used to specify the desired values for the covariates and longitudinal model parameters respectively. For example below we use these functions to predict the survival distribution for a hypothetical subject:
surv_quantities <- SurvivalQuantities(
    mcmc_results,
    grid = GridPrediction(
        times = seq(1, 800, by = 50),
        newdata = dplyr::tibble(
            cov_cat = c("A", "B"),
            cov_cont = c(1.2, 2)
        ),
        params = list(
            intercept = 40,
            slope = 0.05
        )
    )
)
autoplot(surv_quantities)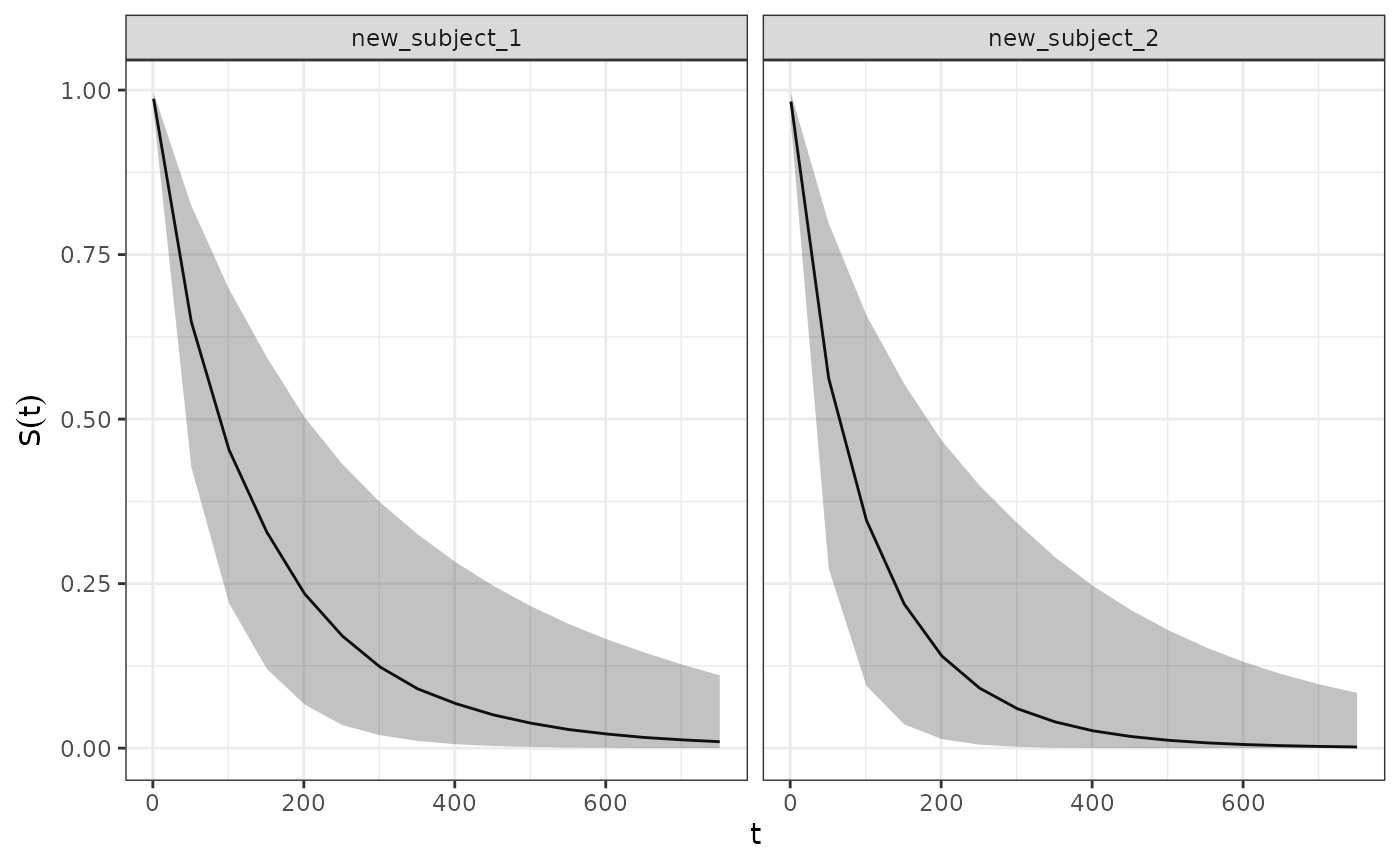
The exact names that are required for the params argument (i.e. the longitudinal model parameters) can be found by running getPredictionNames() on the longitudinal model object. For example:
getPredictionNames(LongitudinalGSF())
#> [1] "b"   "s"   "g"   "phi"
Brier Score
The brierScore() method can be used to extract the Brier Scores (predictive performance measure) from our SurvivalQuantities object.
sq <- SurvivalQuantities(
    mcmc_results,
    grid = GridFixed(times = c(1, 50, 100, 400, 800)),
    type = "surv"
)
brierScore(sq)
#>          1         50        100        400        800
#> 0.01951984 0.17178304 0.23765596 0.14866746 0.06090117
Initial Values
By default jmpost will set the initial values for all parameters to be a random value drawn from the prior distribution that has been shrunk towards the mean of said distribution e.g. for a prior_normal(4, 2) the initial value for each chain will be:
4 * shrinkage_factor + rnorm(1, 4, 2) * (1 - shrinkage_factor)Note that the shrinkage factor is set to 0.5 by default and can be changed via the jmpost.prior_shrinkage option e.g.
options("jmpost.prior_shrinkage" = 0.7)If you wish to manually specify the initial values you can do so via the initialValues() function. For example:
joint_model <- JointModel(
    longitudinal = LongitudinalRandomSlope(),
    survival = SurvivalExponential(),
    link = linkNone()
)
initial_values <- initialValues(joint_model, n_chains = 2)

initial_values[[1]]$lm_rs_intercept <- 0.2
initial_values[[2]]$lm_rs_intercept <- 0.3

mcmc_results <- sampleStanModel(
    joint_model,
    data = DataJoint(...),
    init = initial_values,
    chains = 2
)
Note the following:
-
initialValues()will return a list of lists where each sublist contains the initial values for the corresponding chain index. -
initialValues()by default just returns 1 initial value for each parameter; thesampleStanModel()function will then broadcast this number as many times as required e.g. if you have 3 covariates in your survival model then the initial value for the Beta coeficient will be repeated 3 times. If however you want to specify individual initial values for each covariate you can do so by passing in a vector of the same length as the number of covariates. -
initialValues()will not check if the proposed values are valid for constrained parameters. That is, if you are using aprior_cauchy(0, 1)prior for a parameter that should be>0then you will need to manually set the initial value (as described above) to ensure that it is a valid value. - For constrained parameters (e.g. variance parameters that must be )
initialValues()will continuously sample and discard initial values until it generates one that meet the constraints. If after 100 attempts no valid initial value has been found then it will throw an error.
Covariates in Longitudinal Models
The covariate longitudinal models allow subject-level baseline covariates to affect the parameters of a longitudinal trajectory. They are provided by LongitudinalRandomSlopeCov(), LongitudinalSteinFojoCov(), LongitudinalGSFCov(), and LongitudinalClaretBrunoCov().
Each constructor uses one-sided formulas to specify the covariates for each model parameter. The variables in these formulas must be columns in the data passed to DataSubject(). The intercept column implied by a formula is removed because each predictor has a separate *_intercept_prior; the corresponding *_coefficients_prior controls the remaining design-matrix coefficients. For example, ~ arm + cov_cont models differences from the reference arm together with a linear effect of cov_cont.
Predictors can use "linear", "proportional", "exponential", or "log-linear" parametrizations. The defaults use linear predictors for location parameters and log-linear predictors for scale parameters, keeping the latter positive. Covariates may differ between parameters and may overlap with, or differ from, the covariates in the survival model.
The following short example uses the data prepared above. It lets the continuous baseline covariate affect the subject intercept, treatment arm affect the mean slope, and uses a common slope standard deviation. The usual DataJoint() and sampleStanModel() workflow is otherwise unchanged.
covariate_model <- JointModel(
    longitudinal = LongitudinalRandomSlopeCov(
        mu_formula = ~cov_cont,
        slope_mu_formula = ~arm,
        slope_sigma_formula = ~1,
        mu_intercept_prior = prior_normal(30, 10),
        mu_coefficients_prior = prior_normal(0, 3),
        slope_mu_intercept_prior = prior_normal(1, 2),
        slope_mu_coefficients_prior = prior_normal(0, 2),
        slope_sigma_intercept_prior = prior_normal(log(0.2), 0.5),
        sigma = prior_lognormal(log(20), 0.5)
    )
)

set.seed(481)
covariate_results <- sampleStanModel(
    covariate_model,
    data = joint_data,
    iter_sampling = 100,
    iter_warmup = 100,
    chains = 1,
    parallel_chains = 1,
    refresh = 0
)
#> Running MCMC with 1 chain...
#>
#> Chain 1 WARNING: There aren't enough warmup iterations to fit the
#> Chain 1          three stages of adaptation as currently configured.
#> Chain 1          Reducing each adaptation stage to 15%/75%/10% of
#> Chain 1          the given number of warmup iterations:
#> Chain 1            init_buffer = 15
#> Chain 1            adapt_window = 75
#> Chain 1            term_buffer = 10
#> Chain 1 finished in 0.3 seconds.

cmdstanr::as.CmdStanMCMC(covariate_results)$summary(
    c(
        "lm_rsc_mu_intercept",
        "lm_rsc_mu_coefficients",
        "lm_rsc_slope_mu_intercept",
        "lm_rsc_slope_mu_coefficients"
    )
)
#> Warning: The ESS has been capped to avoid unstable estimates.
#> # A tibble: 4 × 10
#>   variable        mean median     sd    mad     q5   q95  rhat ess_bulk ess_tail
#>   <chr>          <dbl>  <dbl>  <dbl>  <dbl>  <dbl> <dbl> <dbl>    <dbl>    <dbl>
#> 1 lm_rsc_mu_in… 27.6   27.6   0.486  0.554  26.7   28.3  1.28      2.83     16.6
#> 2 lm_rsc_mu_co…  1.80   1.80  0.329  0.379   1.24   2.27 1.41      2.28     21.0
#> 3 lm_rsc_slope…  1.02   1.02  0.0363 0.0395  0.963  1.07 1.01    133.       59.9
#> 4 lm_rsc_slope…  0.949  0.954 0.0560 0.0531  0.856  1.03 0.993   200       102.
The coefficient names and their order follow the non-intercept columns of the formula’s design matrix. In a real analysis, use informative priors where possible, run longer chains, and assess convergence as described above.