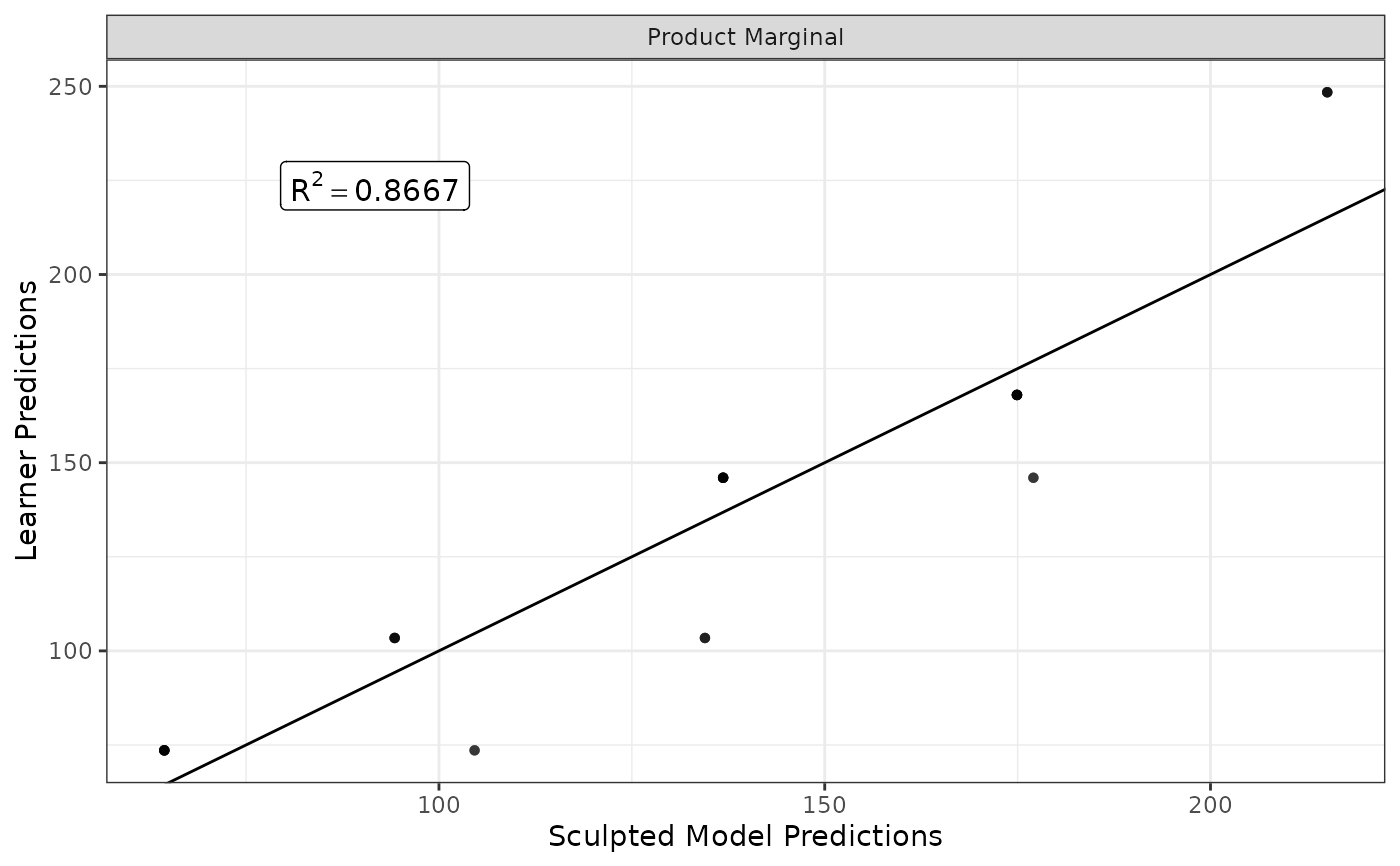
Plot additivity scatterplot(-s) with R^2 value(-s)
g_additivity.RdPlot additivity scatterplot(-s) with R^2 value(-s)
Arguments
- sp
Sculpted predictions. Either as a vector or as a list of those.
- lp
Learner predictions. Either as a vector or as a list of those. Same size as
sp.- descriptions
(Optional) Descriptions of the models to be shown on the plot. Same size as
spifspis provided as a list.- cex
cexgraphical parameter.- plot_only
(
logical) Return plot only or plot with the R^2 value? Defaults to the first (i.e.TRUE).
Examples
df <- mtcars
df$vs <- as.factor(df$vs)
model <- rpart::rpart(
  hp ~ mpg + carb + vs,
  data = df,
  control = rpart::rpart.control(minsplit = 10)
)
model_predict <- function(x) predict(model, newdata = x)
covariates <- c("mpg", "carb", "vs")
pm <- sample_marginals(df[covariates], n = 50, seed = 5)

rs <- sculpt_rough(
  dat = pm,
  model_predict_fun = model_predict,
  n_ice = 10,
  seed = 1,
  verbose = 0
)

g_additivity(
  sp = predict(rs, pm),
  lp = model_predict(pm),
  descriptions = "Product Marginal"
)