Calibration plot
calibrationProfile.RdCalibration curve risk estimates
Arguments
- outcome
Vector of binary outcome for each observation.
- score
Numeric vector of continuous predicted risk score.
- methods
-
Character vector of method names (case-insensitive) for plotting curves or a named list where elements are method function and its arguments. Default is set to
list(gam = list(method = "gam", fitonPerc = FALSE)).Full options are:
c("binned", "pava", "mspline", "gam", "cgam").To specify arguments per method, use lists. For example:
list(
  pava = list(method = "pava", ties = "primary"),
  mspline = list(method = "mspline", fitonPerc = TRUE),
  gam = list(method = "gam", bs = "tp", logscores = FALSE),
  bin = list(method = "binned", bins = 10),
)
See section "Estimation" for more details.
- include
-
Character vector (case-insensitive, partial matching) or
NULLspecifying what quantities to include in the plot.Default is:
c("loess", "citl").Full options are:
c("loess", "citl", "rug", "datapoints")orNULL. "loess" adds a Loess fit, "citl" stands for "Calibration in the large", "rug" adds rug ticks ofscorebyoutcome(top x-axis:scoreforoutcome == 1, bottom x-axis:scoreforoutcome == 0), "datapoints" adds jitteredscorebyoutcome(slightly shifted away from 0 / 1 y-values), "NULL" stands for no extra information. - plot.raw
Logical to show percentiles or raw values. Defaults to
TRUE(i.e. rawscore).- rev.order
Logical to reverse ordering of scores. Defaults to
FALSE.- margin.type
Type of additional margin plot, can be one of
c("density", "histogram", "boxplot", "violin", "densigram"). SeeggExtra::ggMarginal()for more details.- ...
Additional arguments passed to
ggExtra::ggMarginal().
Estimation
The methods argument specifies the estimation method.
You can provide either a vector of strings, any of
("asis" is not available for calibrationProfile),
or a named list of lists.
In the latter case, the inner list must have an element "method",
which specifies the estimation function (one of those above),
and optionally other elements, which are passed to the estimation function.
For example:
To see what arguments are available for each estimation method,
see the documentation of that function.
The naming convention is getXest,
where X stands for the estimation method, for example getGAMest().
"gam", "cgam", and "mspline" always fit on percentiles by default.
To change this, use fitonPerc = FALSE, for example
"gam" and "cgam" methods are wrappers of mgcv::gam() and cgam::cgam(), respectively.
The default values of function arguments (like k, the number of knots in mgcv::s())
mirror the package defaults.
Examples
# Read in example data
auroc <- read.csv(system.file("extdata", "sample.csv", package = "stats4phc"))
rscore <- auroc$predicted_calibrated
truth <- as.numeric(auroc$actual)
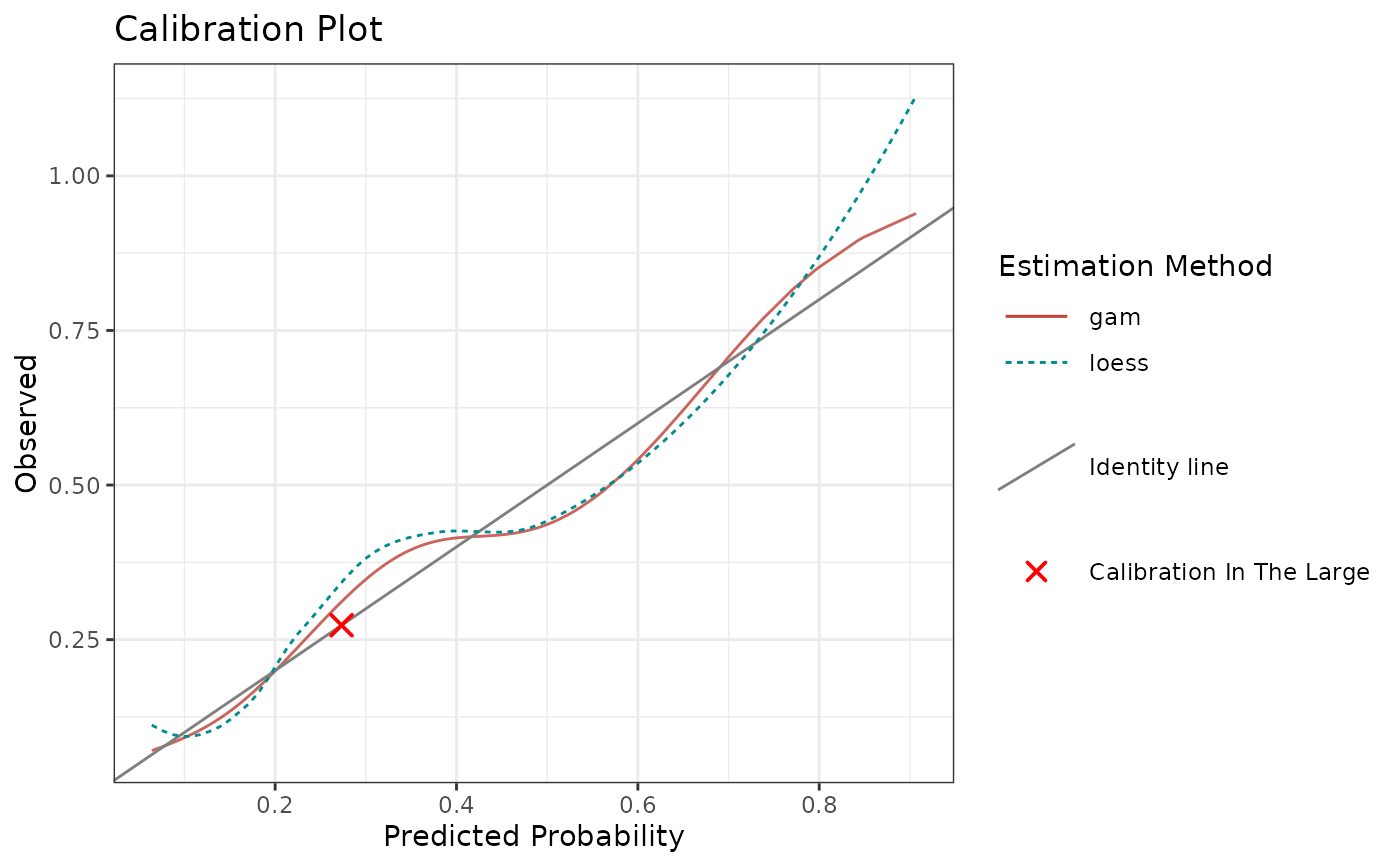
# Default calibration plot
p1 <- calibrationProfile(outcome = truth, score = rscore)
p1$plot
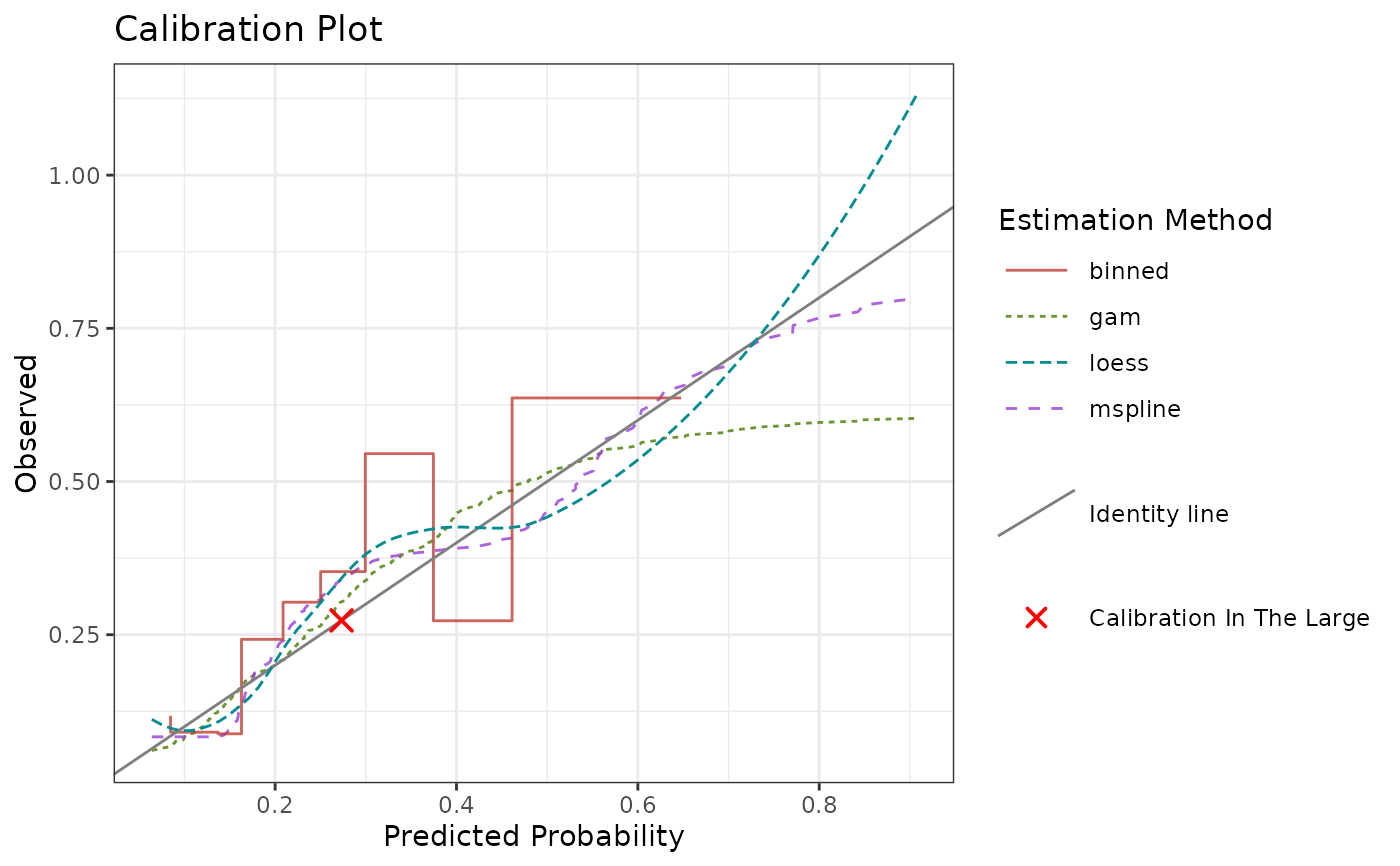
 # Specifying multiple estimation methods
# By default, all the methods fit on percentiles
calibrationProfile(
outcome = truth,
score = rscore,
methods = c("gam", "mspline", "binned")
)$plot
# Specifying multiple estimation methods
# By default, all the methods fit on percentiles
calibrationProfile(
outcome = truth,
score = rscore,
methods = c("gam", "mspline", "binned")
)$plot
 # Specifying multiple estimation methods with parameters
calibrationProfile(
outcome = truth,
score = rscore,
methods = list(
gam = list(method = "gam", fitonPerc = FALSE, k = 3),
mspline = list(method = "mspline"),
bin = list(method = "binned", quantiles = 5)
)
)$plot
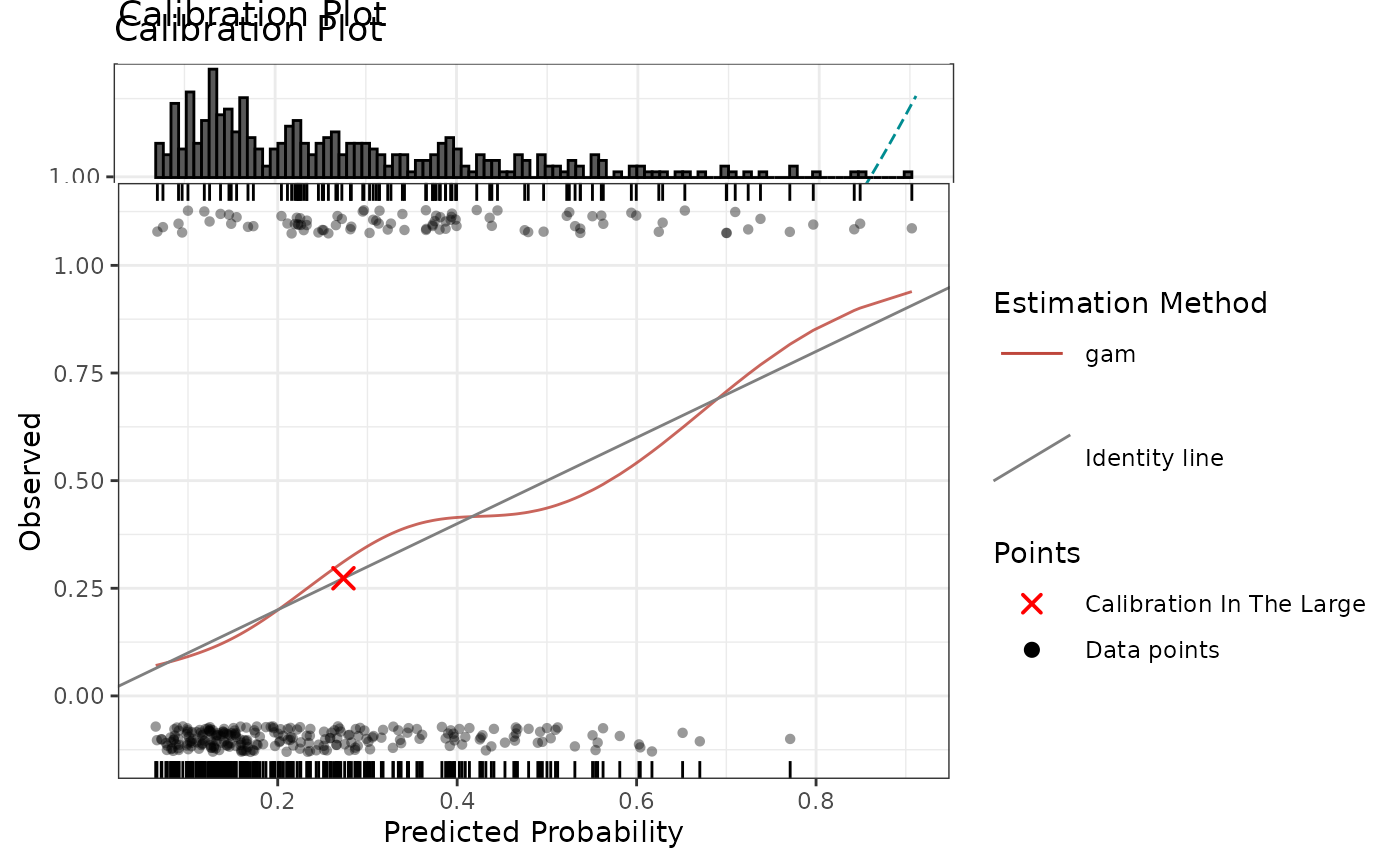
# Additional quantities and marginal histogram with specified number of bins
calibrationProfile(
outcome = truth,
score = rscore,
include = c("rug", "datapoints", "citl"),
# or use partial matching: include = c("r", "d", "c"),
margin.type = "histogram",
bins = 100 # passed to ggExtra::ggMarginal
)$plot
# Specifying multiple estimation methods with parameters
calibrationProfile(
outcome = truth,
score = rscore,
methods = list(
gam = list(method = "gam", fitonPerc = FALSE, k = 3),
mspline = list(method = "mspline"),
bin = list(method = "binned", quantiles = 5)
)
)$plot
# Additional quantities and marginal histogram with specified number of bins
calibrationProfile(
outcome = truth,
score = rscore,
include = c("rug", "datapoints", "citl"),
# or use partial matching: include = c("r", "d", "c"),
margin.type = "histogram",
bins = 100 # passed to ggExtra::ggMarginal
)$plot